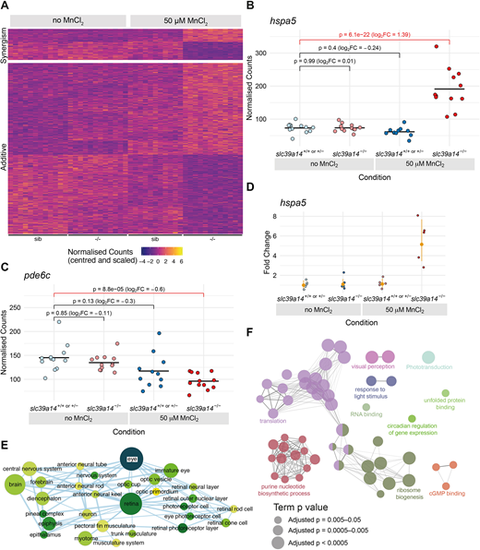
Effect of Mn treatment in slc39a14−/− mutants. (A) Heatmap of the expression of all 613 genes with a significant difference between exposed mutant and unexposed sibling embryos, but without without significant effects of treatment or genotype. The heatmaps are split into genes that show either synergistic or additive effects of the individual genotype and treatment effects. Each row represents a different gene and each column is a sample. The normalised counts for each gene have been mean centred and scaled by dividing by the standard deviation. (B) Example of a gene (hspa5) with a synergistic effect of treatment and genotype. The difference between the exposed mutants and unexposed siblings cannot be explained by adding together the separate effects of Mn treatment and the slc39a14−/− mutation. Unexposed sibling embryos are indicated in light blue and MnCl2-exposed embryos are in dark blue. Unexposed mutants are coloured light red and exposed mutants are dark red. (C) Example of a gene (pde6c) that has an additive effect of treatment and genotype. The difference between exposed mutants and unexposed siblings is consistent with adding together the two sub-threshold effects of treatment and genotype produce. Colour scheme is as in B. FC, fold change. Wald test was used to determine significance in B,C. (D) qRT-PCR showed comparable gene expression changes for hspa5 as for the single-embryo sequencing dataset. The individual samples are displayed as fold change relative to the mean value for unexposed siblings, and the mean and 95% confidence intervals for each condition indicated are in orange. Compare with B. (E) Enrichment Map network of the Zebrafish Anatomy Ontology (ZFA) enrichment results. Each node represents an enriched ZFA term and the edges join nodes that have overlapping genes annotated to them. The width of each edge is proportional to the amount of overlap; nodes are coloured by −log10[adjusted P-value] (Wald test); and the size represents the number of significant genes annotated to the term. (F) ClueGO network diagram of the enrichment of GO terms. Nodes represent enriched GO terms and edges connect nodes that share annotations to the significant genes. Different components of the network are coloured according to the categories as labelled on the diagram. The sizes of the circles represent the adjusted P-values for each GO term as indicated below (Wald test).