
Image
|
Figure Caption
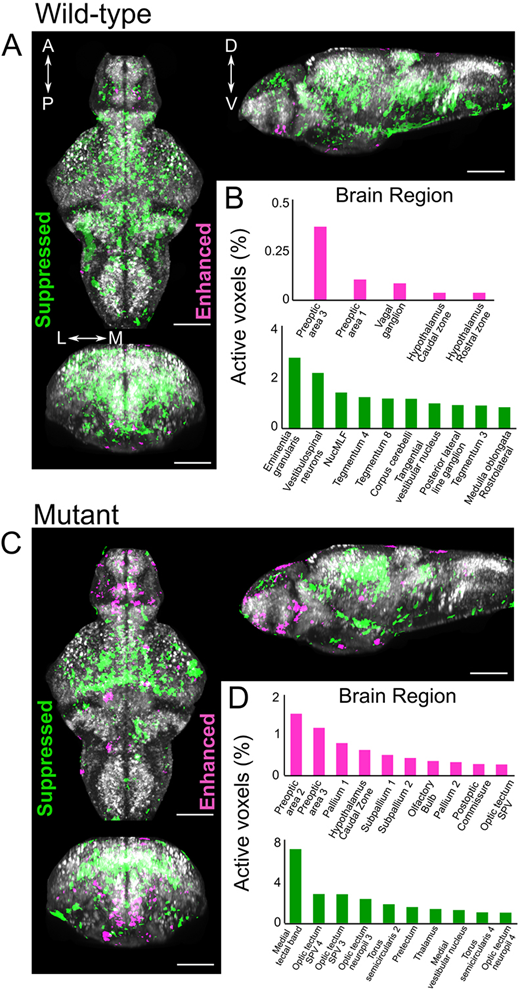
Fig. 4
MnCl2 treatment alters neuronal activity in both wild-type and slc39a14−/− larvae. (A-D) Z-projection of cfos mRNA expression in the brain of wild-type (A) and homozygous mutant larvae (C) at 6 dpf following treatment with 50 µM MnCl2 from 2 dpf. B and D list the brain regions with enhanced (magenta) and suppressed (green) neuronal activity by genotype. A, anterior; P, posterior; D, dorsal; V, ventral; L, lateral; M, medial. Scale bars: 100 µm.
Figure Data
Acknowledgments
This image is the copyrighted work of the attributed author or publisher, and
ZFIN has permission only to display this image to its users.
Additional permissions should be obtained from the applicable author or publisher of the image.
Full text @ Dis. Model. Mech.