
|
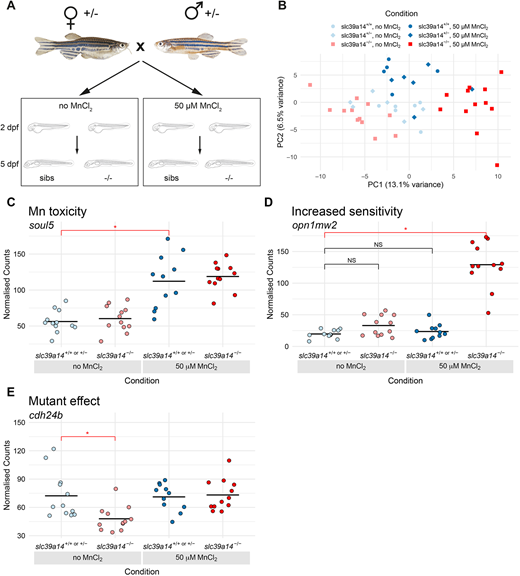
Fig. 1
DeTCT analysis identifies three groups of differentially expressed genes. (A) Diagram of the experiment. Embryos from a slc39a14+/− incross were either left unexposed or exposed to 50 µM MnCl2 from 2 to 5 dpf. (B) Principal component analysis of the samples. Principal component (PC) 1 is plotted on the x-axis and PC2 on the y-axis. Samples belonging to the same condition are grouped together. Circles represent wild-type embryos, diamonds represent heterozygotes and squares represent homozygote mutants. Unexposed sibling embryos are indicated in light blue and MnCl2-exposed embryos are in dark blue. Unexposed mutants are coloured light red and exposed mutants are dark red. (C) Group 1 (Mn toxicity) genes were defined as those with a significant difference between exposed and unexposed siblings (red bar with asterisk). An example plot of normalised counts for the soul5 gene is shown. The colour scheme for C-E is the same as in B. (D) Group 2 (Increased sensitivity) genes were defined as those with a significant difference between exposed mutants and unexposed siblings (red bar with asterisk), but without significant differences between either unexposed mutants or exposed siblings when compared to unexposed siblings (black bars labelled NS, not significant). An example plot of normalised counts for the opn1mw2 gene is shown. (E) Group3 (Mutant effect) was defined as genes with a significant difference between unexposed mutants and unexposed siblings (red bar with asterisk). Example plot of normalised counts for the cdh24b gene. *P<0.05 determined using the Wald test (see Materials and Methods).