
- Title
-
Vertebrate cells differentially interpret ciliary and extraciliary cAMP
- Authors
- Truong, M.E., Bilekova, S., Choksi, S.P., Li, W., Bugaj, L.J., Xu, K., Reiter, J.F.
- Source
- Full text @ Cell
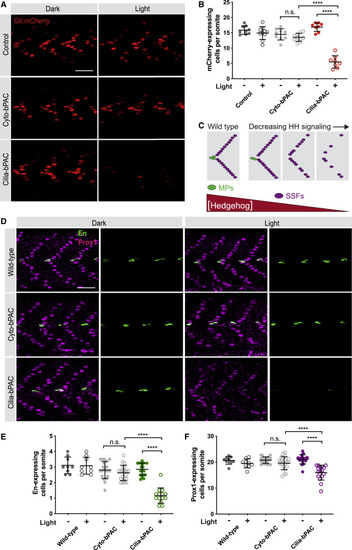
(A) Immunofluorescence imaging of somites 12–14 in 24 hpf Gli:mCherry transgenic embryonic somites without bPAC (control), expressing Cyto-bPAC or expressing Cilia-bPAC raised in the dark or stimulated with light. Scale bar, 40 μm. (B) Quantification of Gli:mCherry-expressing cells per somite. n = 8–10 embryos collected over two independent clutches. Cells in somites 12 through 15 were counted and an average value of cells per somite was determined for each embryo. The average values per embryo were used as individual data points in Figure 2 graphs and statistical analyses. (C) Schematic of how HH signaling affects somitic cell fate. Muscle pioneer cells (MPs, green) express high levels of En and are specified by high levels of HH signaling. Superficial slow fibers (SSFs) express Prox1 and are specified by lower levels of HH signaling. Modest attenuation of HH signaling attenuates MP formation, and more severe attenuation of HH signaling attenuates SFF formation. (D) Immunofluorescence imaging of En (green) and Prox1 (magenta) in wild-type and Cyto-bPAC- or Cilia-bPAC-expressing embryos with or without light stimulation. Scale bar, 40 μm. (E) Quantification of the average number of En-expressing cells per somite. (F) Quantification of the average number of Prox1-expressing cells per somite. n = 9–20 embryos for each condition. Each data point represents the average number of En or Prox1 expressing cells per somite 12 through 15 per 24 hpf embryo. Significance was determined via two-way ANOVA followed by Tukey’s multiple comparison test. A p value <0.05 was considered statistically significant and is denoted as follows: ∗∗∗∗p < 0.0001. Data are represented as means ± SD. |
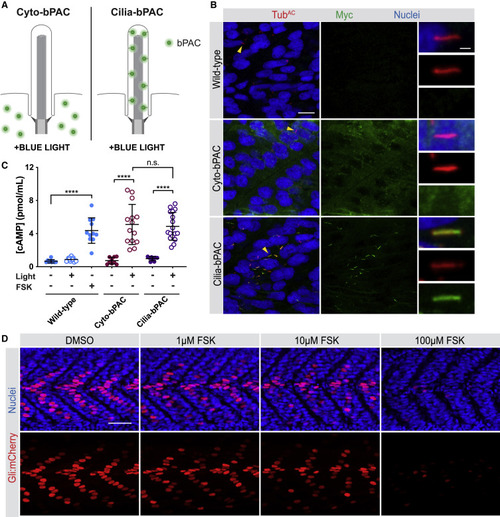
(A) Immunofluorescence imaging of wild-type and transgenic NIH/3T3 cells stably expressing GFP-tagged Cyto-bPAC or Cilia-bPAC under the control of a minimal δ-crystallin promoter stained for GFP-tagged bPAC (green), cilia (TUBAC, red), basal bodies (γTUB, grayscale) and nuclei (blue). Arrowheads indicate cilia depicted in insets. Insets display overlay (top), cilia and basal bodies alone (middle), and GFP-tagged bPAC alone (bottom). Scale bars, 10 μm and 2 μm (inset). (B) Immunoblot of wild-type and transgenic NIH/3T3 cells stably expressing GFP-tagged Cyto-bPAC and Cilia-bPAC under the control of the EF1α promoter. Whole-cell protein lysates were immunoblotted with antibodies to GFP and GAPDH loading control. (C) Quantification of cAMP in wild-type or transgenic cells expressing Cyto-bPAC or Cilia-bPAC under the control of a minimal δ-crystallin promoter by ELISA. Cells were stimulated with pulsed 0.14 mW/cm2 470 nm blue light or kept in the dark in the presence of 100 μM IBMX for 30 min. cAMP concentration was determined by ELISA and normalized to total protein content. n = 4 biological replicates. Significance was determined via two-way ANOVA followed by Tukey’s multiple comparison test. (D) Quantitation of Ciliary Pink Flamindo fluorescence in Cyto-bPAC-expressing (red) or Cilia-bPAC-expressing (blue) cells either with (solid circles) or without blue light (open circles). Cells were stimulated with 100-ms pulses of 52.7 mW/cm2 blue light every 3 s for 1 min. At the end of that minute, 100 μM forskolin was added. We calculated the ratio of Pink Flamindo to mIFP fluorescence normalized to the ratio at t = 0. Each trace represents n > 12 cells from three independent experiments. The maximum Ciliary Pink Flamindo fluorescence on blue light stimulation is also shown. Significance was assessed using two-way ANOVA followed by Tukey’s multiple comparison test. (E) qRT-PCR measurement of Gli1 expression by wild-type, Cyto-bPAC-expressing cells, or Cilia-bPAC-expressing cells stimulated for 4 h with vehicle (DMSO), 200 nM SAG, or 200 nM SAG with pulsed 0.14 mW/cm2 470 nm blue light. n = 3 biological replicates. Significance was assessed using one-way ANOVA followed by Tukey’s multiple comparison test. (F) Ratios of Gli1 expression in wild-type and Cyto-bPAC-expressing or Cilia-bPAC-expressing cells treated with 200 nM SAG and blue light to Gli1 expression treated with 200 nM SAG alone. Significance was assessed using one-way ANOVA followed by Tukey’s multiple comparison test. (G) Immunoblots of GLI3 and GAPDH of whole-cell lysates from wild-type, Cyto-bPAC-expressing, or Cilia-bPAC-expressing cells stimulated as in (E). (H) Quantification of GLI3 repressor (GLI3R) normalized to GAPDH (loading control). n = 3 biological replicates. Significance was assessed using one-way ANOVA followed by Tukey's multiple comparison test. For all panels, p values are indicated as follows: ∗p < 0.05, ∗∗p < 0.01, ∗∗∗p < 0.001 and ∗∗∗∗p < 0.0001. Data are represented as means ± SD. |

(A) Schematic of tools to control a Gɑs-coupled designer GPCR at distinct subcellular locations. PM-DREADD localizes to the plasma membrane. Cilia-DREADD, a fusion with the ciliary protein ARL13B, localizes to cilia. These Gɑs-coupled DREADDs induce cAMP generation on stimulation with their ligand, the otherwise pharmacologically inert drug CNO. (B) Immunofluorescence imaging of wild-type and transgenic NIH/3T3 cells stably expressing GFP-tagged PM-DREADD or Cilia-DREADD. Images depict cells stained for the GFP-tagged DREADDs (GFP, green), cilia (TUBAC, red), basal bodies (γTUB, grayscale), and nuclei (Hoechst, blue). Insets indicate amount of GFP-tagged DREADD localization to the cilium (defined by TUBAC and γTUB). Scale bars, 10 μm and 1 μm (inset). (C) Quantification of cAMP in wild-type and PM-DREADD- or Cilia-DREADD-expressing NIH/3T3 transgenic cell lines. Cells were stimulated with either vehicle (DMSO) or 100 nM CNO in the presence of 10 μM IBMX for 3 h. cAMP concentration was determined by ELISA and normalized to total protein content. n = 4 biological replicates. Significance was determined via two-way ANOVA followed by Tukey’s multiple comparison test. Data are represented as means ± SD. (D) Expression of Gli1 by wild-type and PM-DREADD- or Cilia-DREADD-expressing cells stimulated with vehicle (DMSO), 200 nM SAG, or 200 nM SAG and 5 nM CNO for 5 h before measurement by qRT-PCR. n = 4–5 biological replicates. Significance was determined via one-way ANOVA followed by Tukey’s multiple comparison test. (E) Ratios of Gli1 expression in wild-type and PM-DREADD- or Cilia-DREADD-expressing cells treated with 200 nM SAG and 5 nM CNO to Gli1 expression treated with 200 nM SAG alone. Significance was determined via one-way ANOVA followed by Tukey’s multiple comparison test. n = 4–5 biological replicates. (F) Immunofluorescence imaging of wild-type and transgenic NIH/3T3 cells stably expressing SSTR3-GFP, a ciliary Gαi-coupled GPCR, fused to GFP. Images depict cells stained for SSTR3-GFP (GFP, green), cilia (ARL13B, red), basal bodies (FOP, grayscale), and nuclei (Hoechst, blue). Cells were treated either vehicle (DMSO) or 10 μM somatostatin (SST) for 5 h. Insets depict SSTR3-GFP localization to the cilium (defined by ARL13B and FOP). Scale bars, 10 μm and 1 μm (inset). (G) Quantification of SSTR3-mediated inhibition of cAMP production. Wild-type and SSTR3-GFP-expressing NIH/3T3 cells were stimulated with either vehicle (DMSO), 10 μM SST, 10 μM FSK, or 10 μM FSK and 10 μM SST in the presence of 10 μM IBMX for 30 min. cAMP concentration was measured by ELISA and normalized to total protein content. n = 3–6 biological replicates. Significance was determined via one-way ANOVA followed by Tukey’s multiple comparison test. Data are represented as means ± SD. (H) Expression of Gli1 by wild-type and SSTR3-GFP-expressing NIH/3T3 cells treated with vehicle (DMSO), 3 nM SAG, or 10 μM SST for 5 h and measured by qRT-PCR. n = 4 biological replicates. Significance was determined via one-way ANOVA followed by Tukey’s multiple comparison test. Data are represented as means ± SD. For all panels, a p value <0.05 was considered statistically significant and is denoted as follows: ∗p < 0.05, ∗∗p < 0.01, ∗∗∗p < 0.001, and ∗∗∗∗p < 0.0001. |
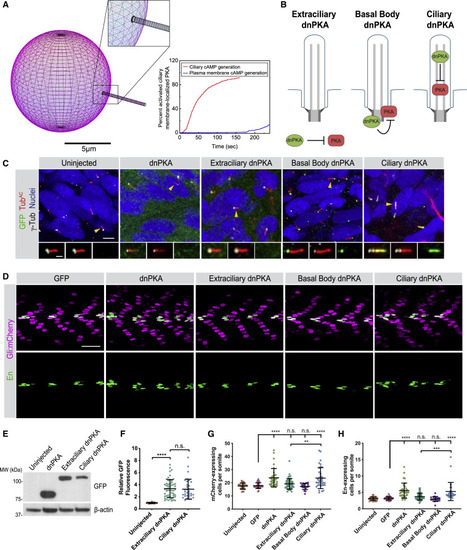
(A) Modeling differential ciliary membrane localized PKA activation on cAMP generated at either the ciliary membrane or at the plasma membrane. Left panel: simulated distribution of PKA localization (magenta) to the plasma membrane and cilium (inset). Scale bar, 5 μm. Right panel: the percent of activated ciliary membrane localized PKA upon either ciliary membrane or plasma membrane cAMP generation. (B) Schematic of tools to inhibit PKA at distinct subcellular locations. Dominant-negative PKA (dnPKA), a form of PKA-R that constitutively binds and inhibits PKA-C, was fused to RAB23 S23N to prevent it from localizing to cilia (Extraciliary dnPKA). dnPKA was fused to RAB23 Q68L to localize it to cilia (Ciliary dnPKA). dnPKA was fused to 2x PACT to localize it to the basal body (Basal Body dnPKA). (C) Immunofluorescence imaging of zebrafish somites either uninjected or expressing GFP-tagged untargeted dnPKA, Extraciliary dnPKA, Basal Body dnPKA, or Ciliary dnPKA. Images depict 24 hpf somites stained for the GFP tag on dnPKA (green), cilia (TubAC, red), basal bodies (γTUB, grayscale), and nuclei (Hoechst, blue). Arrowheads indicate cilia depicted in inset. Insets display overlay of dnPKA, cilia, and basal bodies (left), overlay of cilia and basal bodies (middle), and dnPKA alone (right). Scale bars, 4 μm and 1 μm (inset). (D) Immunofluorescence imaging of Gli:mCherry-transgenic somites expressing GFP alone or the indicated dnPKAs. Images depict 24 hpf somites stained for En (green) and mCherry (magenta). Scale bar, 40 μm. (E) Immunoblot of lysates from 24 hpf zebrafish embryos expressing indicated GFP-tagged forms of dnPKA. Blotting for β-actin controls for loading. (F) Relative GFP fluorescence of control uninjected embryos, Extraciliary dnPKA-expressing embryos, and Ciliary dnPKA-expressing embryos. Fluorescence was normalized to the mean of uninjected embryos. (G) Quantification of Gli:mCherry-expressing cells per somite of uninjected embryos, and those expressing GFP, untargeted dnPKA, Extraciliary dnPKA, Basal Body dnPKA, or Ciliary dnPKA. Each point represents the number of mCherry-expressing cells averaged over four somites per embryo. Cells in somites 12 through 15 were counted and an average value of cells per somite was determined for each embryo. The average values per embryo were used as individual data points in graphs and statistical analyses in (G) and (H). (H) Quantification of En-expressing MPs per somite of uninjected embryos, and those expressing GFP, untargeted dnPKA, Extraciliary dnPKA, Basal Body dnPKA, or Ciliary dnPKA. For Basal Body dnPKA-expressing embryos, n = 18 and for all other conditions, n > 30 from three independent injections. Significance was determined via one-way ANOVA followed by Tukey’s multiple comparison test. A p value <0.05 was considered statistically significant and is denoted as follows: ∗∗p < 0.01, ∗∗∗p < 0.001, and ∗∗∗∗p < 0.0001. Data are represented as means ± SD throughout the figure. |
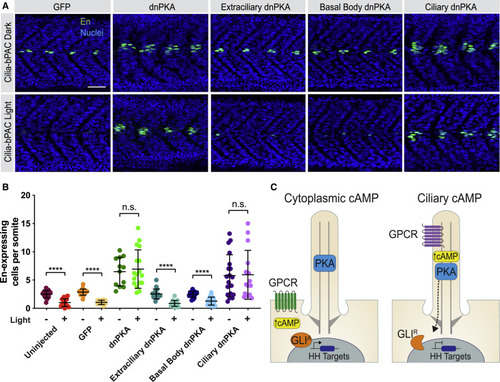
(A) Immunofluorescence imaging of Cilia-bPAC transgenic embryos expressing GFP, untargeted dnPKA, Extraciliary dnPKA, Basal Body dnPKA, or Ciliary dnPKA and either raised in the dark or stimulated with light. Images depict 24 hpf somites stained for MPs (En, green) and nuclei (Hoechst, blue). Scale bar, 40 μm. (B) Quantification of En-expressing cells per somite. n = 12–20 embryos per condition, from three independent injections. Statistical significance was assessed using a two-tailed unpaired t test to compare dark- and light-treated embryos for each construct. A p value <0.05 was considered statistically significant and is denoted as follows: ∗∗∗∗p < 0.0001. Data are represented as means ± SD. (C) Schematic model of how ciliary cAMP and PKA regulate HH signal transduction. Ciliary cAMP regulated by ciliary GPCRs locally activates a pool of ciliary PKA, which phosphorylates GLI to generate its transcriptional repressor form (GLIR). Equivalent amounts of cAMP produced by GPCRs in the plasma membrane do not activate ciliary PKA. Thus, upon HH stimulation and in the absence of ciliary PKA activity, GLI assumes its transcriptional activator form (GLIA) and induces HH target gene expression. |
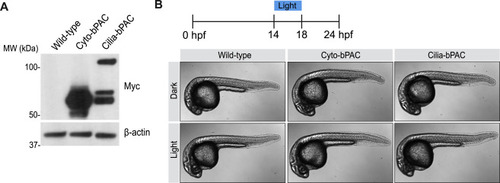
Light activation of Cilia-bPAC and Cyto-bPAC does not morphologically perturb development, related to Figure 1 (A) Immunoblot for Myc-tagged Cyto-bPAC and Cilia-bPAC in 24hpf zebrafish embryo lysates. β-actin serves as a loading control. (B) Whole-mount brightfield images of transgenic Cyto-bPAC and Cilia-bPAC zebrafish embryos either raised in the dark or stimulated with blue light from 14-18 hours post fertilization. |
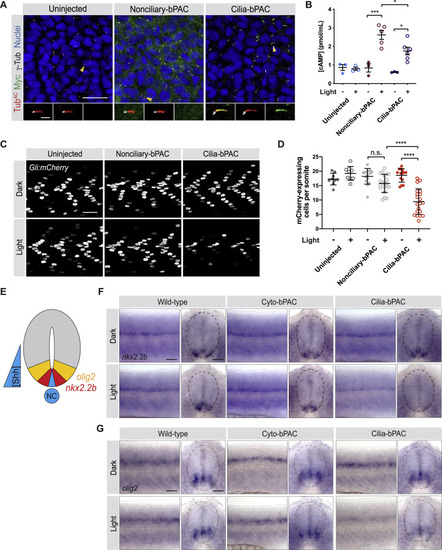
Cilium-generated cAMP specifically inhibits HH signal transduction, related to Figure 2 (A) Immunofluorescence images of zebrafish somites either uninjected or injected with mRNA encoding Myc-tagged Nonciliary-bPAC (ARL13BV359A-bPAC-MYC) or Cilia-bPAC (ARL13B-bPAC-MYC). Images depict 18hpf somites stained for bPAC (Myc, green), cilia (TubAC, red), basal bodies (γTUB, grayscale) and nuclei (Hoechst, blue). Arrowheads indicate cilia depicted in insets. Insets display overlay of bPAC, cilia and basal bodies (left), overlay of cilia and basal bodies (middle), and bPAC alone (right). Scale bars, 20 μm for main images and 2 μm for insets. (B) Quantification of cAMP in uninjected and embryos expressing either Nonciliary-bPAC or Cilia-bPAC. Embryos were stimulated with 0.35mW/cm2 470nm pulsed blue light in the presence of 100 μM IBMX from 14-18hpf. (C) Immunofluorescence images of Gli:mCherry transgenic embryos either uninjected, or injected with mRNA encoding Nonciliary-bPAC or Cilia-bPAC. Embryos were stained for mCherry (greyscale). Embryos were either raised in the dark or stimulated with 0.35mW/cm2 470nm pulsed blue light from 14-18hpf and then allowed to develop until 24hpf. Scale bar, 40 μm. (D) Quantification of Gli:mCherry-expressing cells per somite of uninjected embryos and those injected with mRNA encoding the indicated forms of bPAC. Each point represents the average number of mCherry-expressing cells over somites 12-15 of one embryo. Embryos were generated in three independent sets of injections. For both (B) and (D), significance was determined via two-way ANOVA with Tukey’s multiple comparison test. A p value less than 0.05 was considered statistically significant and is denoted as follows: ∗ < 0.05, ∗∗∗ < 0.001, and ∗∗∗∗ < 0.0001. Data are represented as means ± SD. (E) Schematic of HH-dependent neural tube patterning. A gradient of Shh secreted from the notochord (NT) and medial floorplate (blue) patterns lateral floor plate cells expressing nkx2.2b (red) and motorneuron precursors expressing olig2 (yellow). (F,G) Whole-mount in situ hybridization to detect neural tube markers in wild-type, Cyto-bPAC, and Cilia-bPAC-expressing transgenic zebrafish either raised in the dark or stimulated with blue light. Left panels depict views of lateral whole mount 24hpf embryos. Right panels depict transverse cross-sections. Dotted lines outline the neural tubes. Expression of nkx2.2b (F) and olig2 (G) are reduced specifically in Cilia-bPAC embryos stimulated with light. Scale bar, 40 μm. |
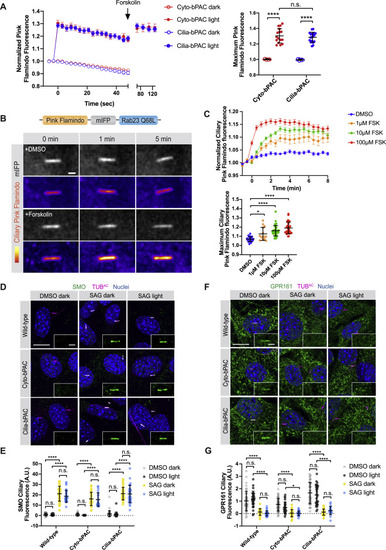
Cilia-bPAC increases ciliary cAMP but does not affect SMO or GPR161 trafficking to or from cilia, related to Figure 3 (A) Untargeted Pink Flamindo expressed in either ciliated Cyto-bPAC (red) or ciliated Cilia-bPAC (blue) cells was stimulated with (solid circles) or without (open circles) 52.7mW/cm2 blue light. 100 μM Forskolin was added at the indicated time (arrow) after blue light stimulation. Left panel depicts quantification of Pink Flamindo fluorescence over time. Right panel depicts the maximum Pink Flamindo fluorescence after blue light stimulation. n > 15 cells quantified over two independent experiments. Significance was determined via two-way ANOVA followed by Tukey’s multiple comparison test. (B) A red-shifted cAMP sensor, Pink Flamindo, was fused to the far-red fluorescent protein mIFP and Rab23 Q68L, which constitutively localizes to the cilium, to generate Ciliary Pink Flamindo. Bottom panel depicts representative images of Pink Flamindo (Fire) and mIFP (greyscale) fluorescence in NIH/3T3 cells stably expressing Ciliary Pink Flamindo upon addition of either vehicle (DMSO) or 100 μM forskolin. Forskolin increases Pink Flamindo fluorescence. Scale bar, 2 μm. (C) Quantification of Ciliary Pink Flamindo fluorescence over time upon increasing concentrations of forskolin (FSK). The ratio of Pink Flamindo fluorescence to mIFP fluorescence at cilia was measured, then normalized to baseline fluorescence (F/F0). Traces represent the average of n > 15 cells over 3 independent experiments. The maximum Ciliary Pink Flamindo fluorescence (Fmax/F0) is also displayed for each cell. Significance was determined via one-way ANOVA followed by Tukey’s multiple comparison test. (D) Immunofluorescence images of wild-type, Cyto-bPAC and Cilia-bPAC NIH/3T3 cells treated with either vehicle (DMSO) or 200nM SAG in the presence or absence of 4 hours of 0.14mW/cm2 pulsed blue light. Cells were stained for SMO (green), cilia (TUBAC, magenta), and nuclei (Hoechst, blue). Insets display SMO localization to the cilium (defined by TUBAC staining). Scale bar, 10 μm. Inset scale bar, 2 μm. (E) Quantification of ciliary SMO immunofluorescence. Fluorescence was normalized to the mean of that of wild-type cells treated with vehicle in the dark. (F) Immunofluorescence images of wild-type, Cyto-bPAC and Cilia-bPAC NIH/3T3 cells stimulated as above and stained for GPR161 (green), cilia (TUBAC, magenta), and nuclei (Hoechst, blue). Insets display GPR161 localization to the cilium (defined by TUBAC staining). Scale bar, 10 μm. Inset scale bar, 2 μm. (G) Quantification of ciliary GPR161 fluorescence. For (B) and (D), significance was determined using one-way ANOVA followed by Tukey’s multiple comparison test. A p value less than 0.05 was considered statistically significant and is denoted as follows: ∗ < 0.05 and ∗∗∗∗ < 0.0001. Data are represented as means ± SD throughout the figure. |
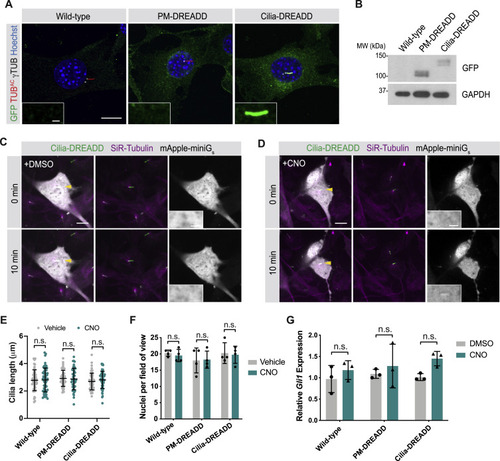
Ciliary-targeted DREADD activates Gαs in cilia, related to Figure 4 (A) Oversaturated immunofluorescence images of transgenic NIH/3T3 cells stably expressing GFP-tagged PM-DREADD or Cilia-DREADD. Images depict cells stained for the GFP-tagged DREADDs (GFP, green), cilia (TUBAC, red), basal bodies (γTUB, grayscale) and nuclei (Hoechst, blue). Insets indicate amount of GFP-tagged DREADD localization to the cilium (defined by TUBAC and γTUB). Scale bars, 10 μm and 1 μm (inset). With increased exposure, PM-DREADD is not observed in the ciliary membrane. (B) Immunoblot for GFP-tagged PM-DREADD and Cilia-DREADD. Immunoblot for GAPDH was used to control for protein loading. (C) Mini-Gs sensors visualized G-protein activity in Cilia-DREADD-expressing cells. Cilia in live cells were identified through enrichment of a tubulin dye (SiR-Tubulin, magenta) and localization of GFP-tagged Cilia-DREADD (green). The mApple-tagged mini-Gs sensor (grayscale) was not enriched in cilia both before and 10 minutes after treatment with vehicle (DMSO). Yellow arrowheads indicate cilia depicted in insets. Scale bars, 10 μm and 2 μm (inset). (D) In Cilia-DREADD cells incubated with 10 μM CNO for 10 minutes, the mApple-tagged mini-Gs sensor (grayscale) accumulated in cilia. Scale bars, 10 μm and 2 μm (inset). (E-F) Quantification of cilia length (E) and nuclei per field of view (F) in wild-type, PM-DREADD- or Cilia-DREADD-expressing cells upon treatment with either vehicle (DMSO) or 5nM CNO for 5 hours. n > 50 cilia were quantified over four random fields. For (E) and (F), significance was determined via two-tailed unpaired t test. (G) Measurement of Gli1 expression in wild-type, PM-DREADD- or Cilia-DREADD-expressing cells treated with either vehicle or 5nM CNO by qRT-PCR. n = 3-4 biological replicates. Significance was determined via one-way ANOVA followed by Tukey’s multiple comparison test. A p value less than 0.05 was considered statistically significant. Data are represented as means ± SD. |
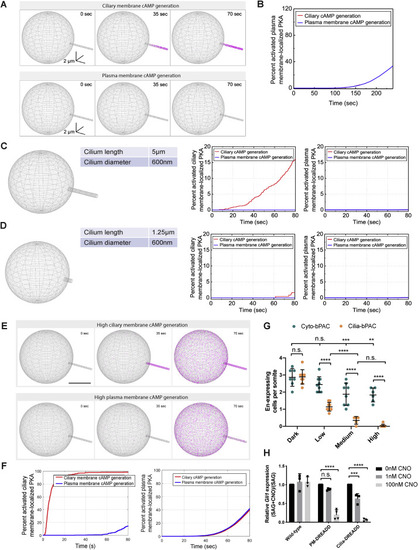
Modeling of PKA at the ciliary and plasma membrane on ciliary and plasma membrane cAMP generation, related to Figure 5 (A) Graphical depiction of PKA activation upon either ciliary membrane or plasma membrane cAMP generation. Grey points indicate inactive PKA. Magenta points indicate PKA computed to have bound 4 cAMP molecules and thus be active. Scale bar, 5 μm. (B) Percent of activated plasma membrane PKA following either ciliary (red) or plasma membrane (blue) cAMP generation, as a function of time (compare to Figure 5 A). (C) The model was re-run with a doubling of ciliary diameter (with a concomitant fourfold increase in ciliary volume). Percent of activated ciliary membrane (middle) and plasma membrane (right) PKA following either ciliary (red) or plasma membrane (blue) cAMP generation, as functions of time. Increasing ciliary diameter is predicted to compromise the difference between ciliary PKA activation by ciliary and plasma membrane cAMP (compare to Figure 5A). (D) To model the effects of changing ciliary diameter and volume separately, the model was re-run with the larger ciliary diameter, but keeping ciliary volume equal to the original model described in Figure S5A by reducing ciliary length. Percent of activated ciliary membrane (middle) and plasma membrane (right) PKA following either ciliary (red) or plasma membrane (blue) cAMP generation, as functions of time. Decreasing ciliary length is predicted to further compromise the difference between ciliary PKA activation by ciliary and plasma membrane cAMP. (E) Graphical depiction of PKA activation upon high levels of either ciliary membrane or plasma membrane cAMP generation. Grey points indicate inactive PKA. Magenta points indicate PKA computed to have bound 4 cAMP molecules and thus be active. Scale bar, 5 μm. (F) Percent of activated ciliary membrane- (left panel) or plasma membrane- (right panel) localized PKA upon 340 cAMPs/second generation at either ciliary or plasma membranes. (G) Quantification of En-expressing somitic cells in Cyto-bPAC and Cilia-bPAC transgenic zebrafish embryos stimulated with low (0.065mW/cm2, as utilized in Figure 2), medium (0.35mW/cm2), or high (0.87mW/cm2) intensity blue light from 14-18hpf. Each data point represents the average number of En-expressing cells per somite 12 through 15 per 24hpf embryo. Statistical significance was assessed using a two-way ANOVA followed by Tukey’s multiple comparison test. A p value less than 0.05 was considered statistically significant and is denoted as follows: ∗∗ < 0.01, ∗∗∗ < 0.001, and ∗∗∗∗ < 0.0001. Data are represented as means ± SD. (H) Ratios of Gli1 expression in wild-type and PM-DREADD- or Cilia-DREADD-expressing cells treated with 200nM SAG and indicated concentrations of CNO to Gli1 expression treated with 200nM SAG alone. Significance was determined via one-way ANOVA followed by Tukey’s multiple comparison test. A p value less than 0.05 was considered statistically significant and is denoted as follows: ∗∗∗ < 0.001, and ∗∗∗∗ < 0.0001. Data are represented as means ± SD. |
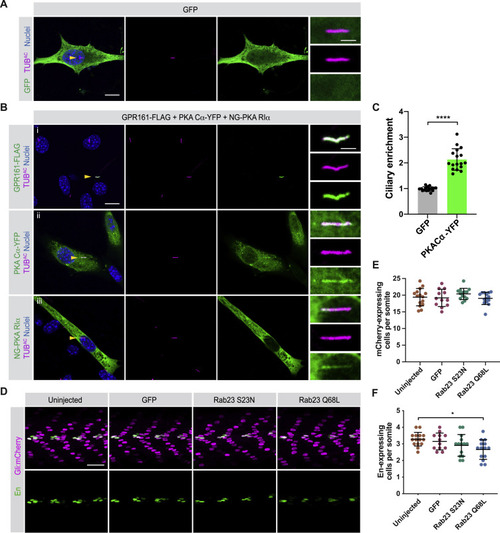
PKA localizes to cilia, and RAB23 expression does not expand zebrafish somite HH signaling or HH-dependent fates, related to Figure 5 (A) Immunofluorescence imaging of NIH/3T3 cells transfected with GFP alone and stained for GFP and cilia (TUBAC). Nuclei are stained with Hoechst. Arrowheads indicate cilia depicted in inset. Scale bars, 10 μm and 2 μm (inset). (B) NIH/3T3 cells were co-transfected with GPR161-FLAG, PKA-Cα-YFP, and NeonGreen-PKA-RIα and stained for cilia (TUBAC) and indicated constructs: (i) GPR161-FLAG (FLAG), (ii) PKA Cα-YFP (YFP), (iii) NG-PKA RIα (NeonGreen). Nuclei are stained with Hoechst. Yellow arrowheads indicate cilia depicted in inset. Scale bars, 10 μm and 2 μm (inset). (C) Quantification of relative ciliary enrichment of PKA-Cα-YFP compared to GFP alone. n = 18 cells from 3 independent experiments. Significance was determined via two-tailed unpaired t test. p values less than 0.05 were considered statistically significant and are denoted as follows: ∗∗∗∗ < 0.0001. Data are represented as means ± SD. (D) Immunofluorescence imaging of somites 12-15 in Gli:mCherry transgenic embryos expressing GFP alone, RAB23 S23N, or RAB23 Q68L. Images depict 24hpf somites stained for MPs (En, green) or mCherry (magenta). (E) Quantification of Gli:mCherry-expressing cells per somite of uninjected embryos, and those expressing GFP, RAB23 S23N, or RAB23 Q68L. mCherry-expressing cells in somites 12 through 15 were counted and the average per somite determined for each embryo. (F) Quantification of En-expressing MPs per somite of uninjected embryos, and those expressing GFP, RAB23 S23N, or RAB23 Q68L. n > 12 embryos quantified from two injections. Significance was determined by one-way ANOVA followed by Tukey’s multiple comparison test. p values less than 0.05 were considered statistically significant and are denoted as follows: ∗ < 0.05. Data are represented as means ± SD. |
Reprinted from Cell, 184(11), Truong, M.E., Bilekova, S., Choksi, S.P., Li, W., Bugaj, L.J., Xu, K., Reiter, J.F., Vertebrate cells differentially interpret ciliary and extraciliary cAMP, 2911-2926.e18, Copyright (2021) with permission from Elsevier. Full text @ Cell