
Fig. S3
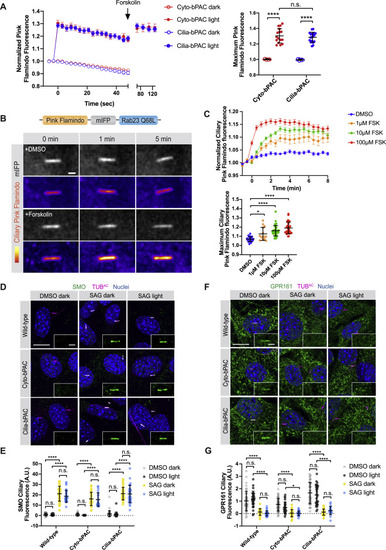
Cilia-bPAC increases ciliary cAMP but does not affect SMO or GPR161 trafficking to or from cilia, related to Figure 3 (A) Untargeted Pink Flamindo expressed in either ciliated Cyto-bPAC (red) or ciliated Cilia-bPAC (blue) cells was stimulated with (solid circles) or without (open circles) 52.7mW/cm2 blue light. 100 μM Forskolin was added at the indicated time (arrow) after blue light stimulation. Left panel depicts quantification of Pink Flamindo fluorescence over time. Right panel depicts the maximum Pink Flamindo fluorescence after blue light stimulation. n > 15 cells quantified over two independent experiments. Significance was determined via two-way ANOVA followed by Tukey’s multiple comparison test. (B) A red-shifted cAMP sensor, Pink Flamindo, was fused to the far-red fluorescent protein mIFP and Rab23 Q68L, which constitutively localizes to the cilium, to generate Ciliary Pink Flamindo. Bottom panel depicts representative images of Pink Flamindo (Fire) and mIFP (greyscale) fluorescence in NIH/3T3 cells stably expressing Ciliary Pink Flamindo upon addition of either vehicle (DMSO) or 100 μM forskolin. Forskolin increases Pink Flamindo fluorescence. Scale bar, 2 μm. (C) Quantification of Ciliary Pink Flamindo fluorescence over time upon increasing concentrations of forskolin (FSK). The ratio of Pink Flamindo fluorescence to mIFP fluorescence at cilia was measured, then normalized to baseline fluorescence (F/F0). Traces represent the average of n > 15 cells over 3 independent experiments. The maximum Ciliary Pink Flamindo fluorescence (Fmax/F0) is also displayed for each cell. Significance was determined via one-way ANOVA followed by Tukey’s multiple comparison test. (D) Immunofluorescence images of wild-type, Cyto-bPAC and Cilia-bPAC NIH/3T3 cells treated with either vehicle (DMSO) or 200nM SAG in the presence or absence of 4 hours of 0.14mW/cm2 pulsed blue light. Cells were stained for SMO (green), cilia (TUBAC, magenta), and nuclei (Hoechst, blue). Insets display SMO localization to the cilium (defined by TUBAC staining). Scale bar, 10 μm. Inset scale bar, 2 μm. (E) Quantification of ciliary SMO immunofluorescence. Fluorescence was normalized to the mean of that of wild-type cells treated with vehicle in the dark. (F) Immunofluorescence images of wild-type, Cyto-bPAC and Cilia-bPAC NIH/3T3 cells stimulated as above and stained for GPR161 (green), cilia (TUBAC, magenta), and nuclei (Hoechst, blue). Insets display GPR161 localization to the cilium (defined by TUBAC staining). Scale bar, 10 μm. Inset scale bar, 2 μm. (G) Quantification of ciliary GPR161 fluorescence. For (B) and (D), significance was determined using one-way ANOVA followed by Tukey’s multiple comparison test. A p value less than 0.05 was considered statistically significant and is denoted as follows: ∗ < 0.05 and ∗∗∗∗ < 0.0001. Data are represented as means ± SD throughout the figure. |
Reprinted from Cell, 184(11), Truong, M.E., Bilekova, S., Choksi, S.P., Li, W., Bugaj, L.J., Xu, K., Reiter, J.F., Vertebrate cells differentially interpret ciliary and extraciliary cAMP, 2911-2926.e18, Copyright (2021) with permission from Elsevier. Full text @ Cell