
Fig. S5
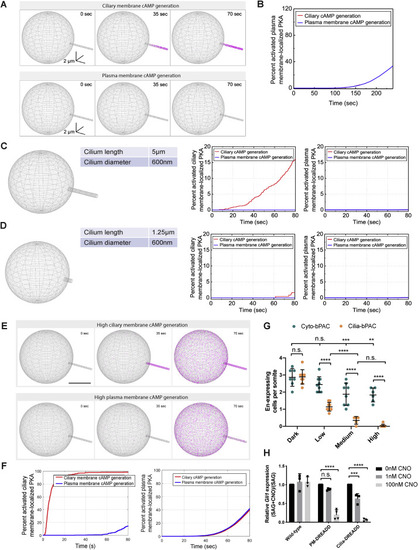
Modeling of PKA at the ciliary and plasma membrane on ciliary and plasma membrane cAMP generation, related to Figure 5 (A) Graphical depiction of PKA activation upon either ciliary membrane or plasma membrane cAMP generation. Grey points indicate inactive PKA. Magenta points indicate PKA computed to have bound 4 cAMP molecules and thus be active. Scale bar, 5 μm. (B) Percent of activated plasma membrane PKA following either ciliary (red) or plasma membrane (blue) cAMP generation, as a function of time (compare to Figure 5 A). (C) The model was re-run with a doubling of ciliary diameter (with a concomitant fourfold increase in ciliary volume). Percent of activated ciliary membrane (middle) and plasma membrane (right) PKA following either ciliary (red) or plasma membrane (blue) cAMP generation, as functions of time. Increasing ciliary diameter is predicted to compromise the difference between ciliary PKA activation by ciliary and plasma membrane cAMP (compare to Figure 5A). (D) To model the effects of changing ciliary diameter and volume separately, the model was re-run with the larger ciliary diameter, but keeping ciliary volume equal to the original model described in Figure S5A by reducing ciliary length. Percent of activated ciliary membrane (middle) and plasma membrane (right) PKA following either ciliary (red) or plasma membrane (blue) cAMP generation, as functions of time. Decreasing ciliary length is predicted to further compromise the difference between ciliary PKA activation by ciliary and plasma membrane cAMP. (E) Graphical depiction of PKA activation upon high levels of either ciliary membrane or plasma membrane cAMP generation. Grey points indicate inactive PKA. Magenta points indicate PKA computed to have bound 4 cAMP molecules and thus be active. Scale bar, 5 μm. (F) Percent of activated ciliary membrane- (left panel) or plasma membrane- (right panel) localized PKA upon 340 cAMPs/second generation at either ciliary or plasma membranes. (G) Quantification of En-expressing somitic cells in Cyto-bPAC and Cilia-bPAC transgenic zebrafish embryos stimulated with low (0.065mW/cm2, as utilized in Figure 2), medium (0.35mW/cm2), or high (0.87mW/cm2) intensity blue light from 14-18hpf. Each data point represents the average number of En-expressing cells per somite 12 through 15 per 24hpf embryo. Statistical significance was assessed using a two-way ANOVA followed by Tukey’s multiple comparison test. A p value less than 0.05 was considered statistically significant and is denoted as follows: ∗∗ < 0.01, ∗∗∗ < 0.001, and ∗∗∗∗ < 0.0001. Data are represented as means ± SD. (H) Ratios of Gli1 expression in wild-type and PM-DREADD- or Cilia-DREADD-expressing cells treated with 200nM SAG and indicated concentrations of CNO to Gli1 expression treated with 200nM SAG alone. Significance was determined via one-way ANOVA followed by Tukey’s multiple comparison test. A p value less than 0.05 was considered statistically significant and is denoted as follows: ∗∗∗ < 0.001, and ∗∗∗∗ < 0.0001. Data are represented as means ± SD. |
Reprinted from Cell, 184(11), Truong, M.E., Bilekova, S., Choksi, S.P., Li, W., Bugaj, L.J., Xu, K., Reiter, J.F., Vertebrate cells differentially interpret ciliary and extraciliary cAMP, 2911-2926.e18, Copyright (2021) with permission from Elsevier. Full text @ Cell