
Fig. S4
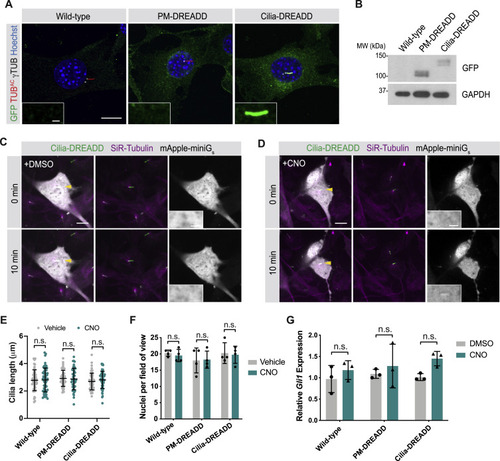
Ciliary-targeted DREADD activates Gαs in cilia, related to Figure 4 (A) Oversaturated immunofluorescence images of transgenic NIH/3T3 cells stably expressing GFP-tagged PM-DREADD or Cilia-DREADD. Images depict cells stained for the GFP-tagged DREADDs (GFP, green), cilia (TUBAC, red), basal bodies (γTUB, grayscale) and nuclei (Hoechst, blue). Insets indicate amount of GFP-tagged DREADD localization to the cilium (defined by TUBAC and γTUB). Scale bars, 10 μm and 1 μm (inset). With increased exposure, PM-DREADD is not observed in the ciliary membrane. (B) Immunoblot for GFP-tagged PM-DREADD and Cilia-DREADD. Immunoblot for GAPDH was used to control for protein loading. (C) Mini-Gs sensors visualized G-protein activity in Cilia-DREADD-expressing cells. Cilia in live cells were identified through enrichment of a tubulin dye (SiR-Tubulin, magenta) and localization of GFP-tagged Cilia-DREADD (green). The mApple-tagged mini-Gs sensor (grayscale) was not enriched in cilia both before and 10 minutes after treatment with vehicle (DMSO). Yellow arrowheads indicate cilia depicted in insets. Scale bars, 10 μm and 2 μm (inset). (D) In Cilia-DREADD cells incubated with 10 μM CNO for 10 minutes, the mApple-tagged mini-Gs sensor (grayscale) accumulated in cilia. Scale bars, 10 μm and 2 μm (inset). (E-F) Quantification of cilia length (E) and nuclei per field of view (F) in wild-type, PM-DREADD- or Cilia-DREADD-expressing cells upon treatment with either vehicle (DMSO) or 5nM CNO for 5 hours. n > 50 cilia were quantified over four random fields. For (E) and (F), significance was determined via two-tailed unpaired t test. (G) Measurement of Gli1 expression in wild-type, PM-DREADD- or Cilia-DREADD-expressing cells treated with either vehicle or 5nM CNO by qRT-PCR. n = 3-4 biological replicates. Significance was determined via one-way ANOVA followed by Tukey’s multiple comparison test. A p value less than 0.05 was considered statistically significant. Data are represented as means ± SD. |
Reprinted from Cell, 184(11), Truong, M.E., Bilekova, S., Choksi, S.P., Li, W., Bugaj, L.J., Xu, K., Reiter, J.F., Vertebrate cells differentially interpret ciliary and extraciliary cAMP, 2911-2926.e18, Copyright (2021) with permission from Elsevier. Full text @ Cell