
Fig. 6
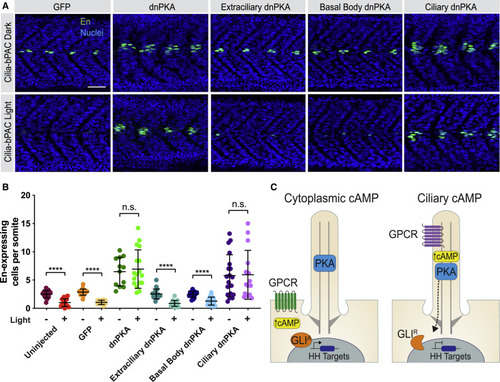
(A) Immunofluorescence imaging of Cilia-bPAC transgenic embryos expressing GFP, untargeted dnPKA, Extraciliary dnPKA, Basal Body dnPKA, or Ciliary dnPKA and either raised in the dark or stimulated with light. Images depict 24 hpf somites stained for MPs (En, green) and nuclei (Hoechst, blue). Scale bar, 40 μm. (B) Quantification of En-expressing cells per somite. n = 12–20 embryos per condition, from three independent injections. Statistical significance was assessed using a two-tailed unpaired t test to compare dark- and light-treated embryos for each construct. A p value <0.05 was considered statistically significant and is denoted as follows: ∗∗∗∗p < 0.0001. Data are represented as means ± SD. (C) Schematic model of how ciliary cAMP and PKA regulate HH signal transduction. Ciliary cAMP regulated by ciliary GPCRs locally activates a pool of ciliary PKA, which phosphorylates GLI to generate its transcriptional repressor form (GLIR). Equivalent amounts of cAMP produced by GPCRs in the plasma membrane do not activate ciliary PKA. Thus, upon HH stimulation and in the absence of ciliary PKA activity, GLI assumes its transcriptional activator form (GLIA) and induces HH target gene expression. |
Reprinted from Cell, 184(11), Truong, M.E., Bilekova, S., Choksi, S.P., Li, W., Bugaj, L.J., Xu, K., Reiter, J.F., Vertebrate cells differentially interpret ciliary and extraciliary cAMP, 2911-2926.e18, Copyright (2021) with permission from Elsevier. Full text @ Cell