
|
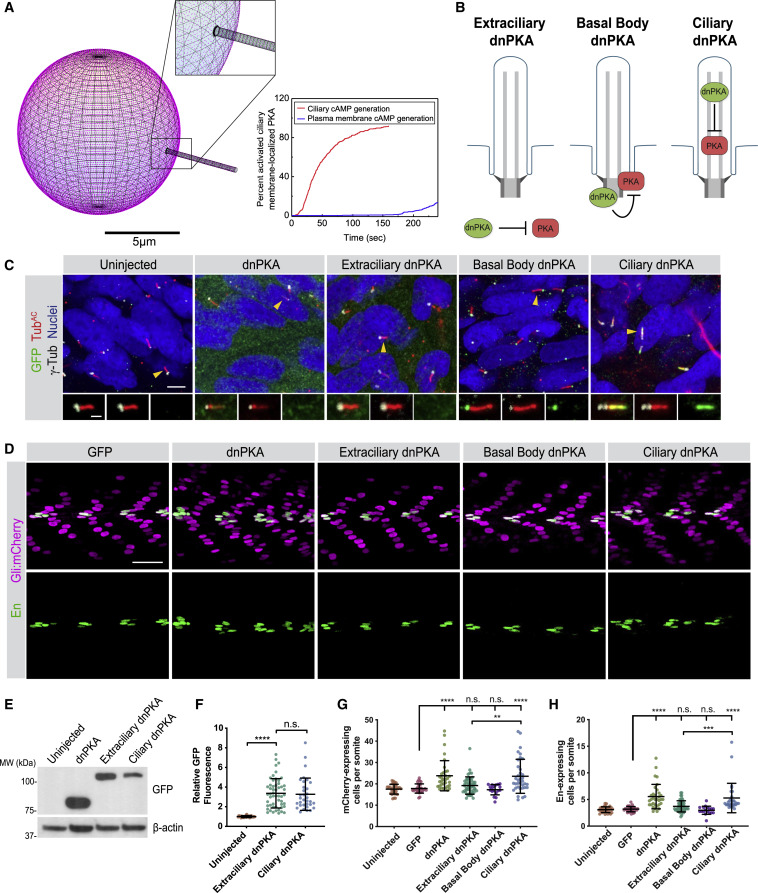
Fig. 5 (A) Modeling differential ciliary membrane localized PKA activation on cAMP generated at either the ciliary membrane or at the plasma membrane. Left panel: simulated distribution of PKA localization (magenta) to the plasma membrane and cilium (inset). Scale bar, 5 μm. Right panel: the percent of activated ciliary membrane localized PKA upon either ciliary membrane or plasma membrane cAMP generation. (B) Schematic of tools to inhibit PKA at distinct subcellular locations. Dominant-negative PKA (dnPKA), a form of PKA-R that constitutively binds and inhibits PKA-C, was fused to RAB23 S23N to prevent it from localizing to cilia (Extraciliary dnPKA). dnPKA was fused to RAB23 Q68L to localize it to cilia (Ciliary dnPKA). dnPKA was fused to 2x PACT to localize it to the basal body (Basal Body dnPKA). (C) Immunofluorescence imaging of zebrafish somites either uninjected or expressing GFP-tagged untargeted dnPKA, Extraciliary dnPKA, Basal Body dnPKA, or Ciliary dnPKA. Images depict 24 hpf somites stained for the GFP tag on dnPKA (green), cilia (TubAC, red), basal bodies (γTUB, grayscale), and nuclei (Hoechst, blue). Arrowheads indicate cilia depicted in inset. Insets display overlay of dnPKA, cilia, and basal bodies (left), overlay of cilia and basal bodies (middle), and dnPKA alone (right). Scale bars, 4 μm and 1 μm (inset). (D) Immunofluorescence imaging of Gli:mCherry-transgenic somites expressing GFP alone or the indicated dnPKAs. Images depict 24 hpf somites stained for En (green) and mCherry (magenta). Scale bar, 40 μm. (E) Immunoblot of lysates from 24 hpf zebrafish embryos expressing indicated GFP-tagged forms of dnPKA. Blotting for β-actin controls for loading. (F) Relative GFP fluorescence of control uninjected embryos, Extraciliary dnPKA-expressing embryos, and Ciliary dnPKA-expressing embryos. Fluorescence was normalized to the mean of uninjected embryos. (G) Quantification of Gli:mCherry-expressing cells per somite of uninjected embryos, and those expressing GFP, untargeted dnPKA, Extraciliary dnPKA, Basal Body dnPKA, or Ciliary dnPKA. Each point represents the number of mCherry-expressing cells averaged over four somites per embryo. Cells in somites 12 through 15 were counted and an average value of cells per somite was determined for each embryo. The average values per embryo were used as individual data points in graphs and statistical analyses in (G) and (H). (H) Quantification of En-expressing MPs per somite of uninjected embryos, and those expressing GFP, untargeted dnPKA, Extraciliary dnPKA, Basal Body dnPKA, or Ciliary dnPKA. For Basal Body dnPKA-expressing embryos, n = 18 and for all other conditions, n > 30 from three independent injections. Significance was determined via one-way ANOVA followed by Tukey’s multiple comparison test. A p value <0.05 was considered statistically significant and is denoted as follows: ∗∗p < 0.01, ∗∗∗p < 0.001, and ∗∗∗∗p < 0.0001. Data are represented as means ± SD throughout the figure.
Reprinted from Cell, 184(11), Truong, M.E., Bilekova, S., Choksi, S.P., Li, W., Bugaj, L.J., Xu, K., Reiter, J.F., Vertebrate cells differentially interpret ciliary and extraciliary cAMP, 2911-2926.e18, Copyright (2021) with permission from Elsevier. Full text @ Cell