
|
Fig. S2 Cilium-generated cAMP specifically inhibits HH signal transduction, related to Figure 2
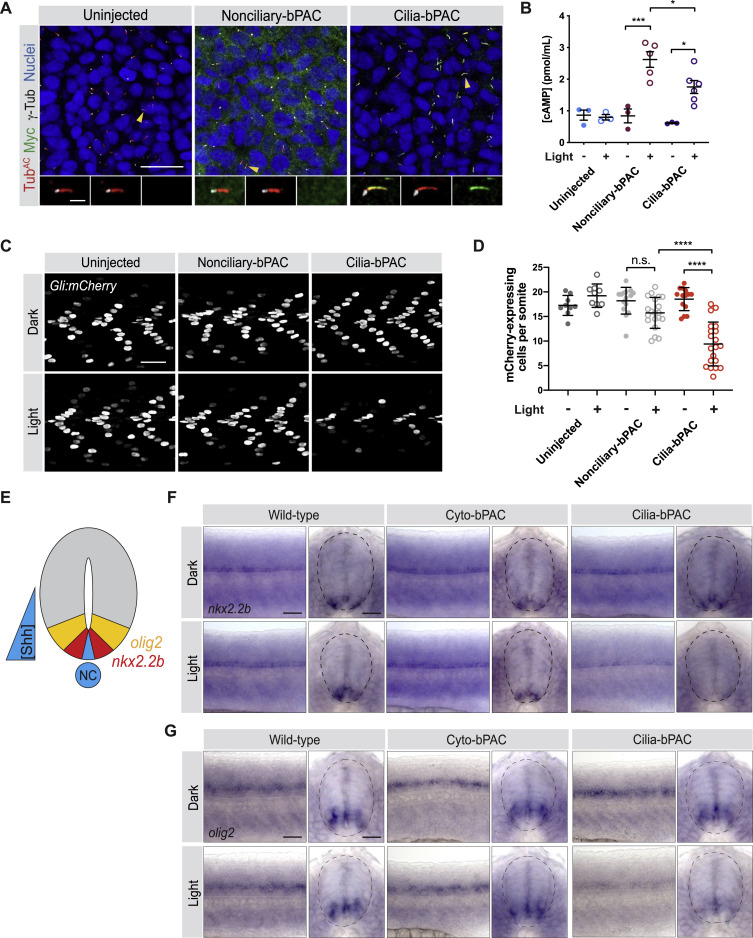
(A) Immunofluorescence images of zebrafish somites either uninjected or injected with mRNA encoding Myc-tagged Nonciliary-bPAC (ARL13BV359A-bPAC-MYC) or Cilia-bPAC (ARL13B-bPAC-MYC). Images depict 18hpf somites stained for bPAC (Myc, green), cilia (TubAC, red), basal bodies (γTUB, grayscale) and nuclei (Hoechst, blue). Arrowheads indicate cilia depicted in insets. Insets display overlay of bPAC, cilia and basal bodies (left), overlay of cilia and basal bodies (middle), and bPAC alone (right). Scale bars, 20 μm for main images and 2 μm for insets.
(B) Quantification of cAMP in uninjected and embryos expressing either Nonciliary-bPAC or Cilia-bPAC. Embryos were stimulated with 0.35mW/cm2 470nm pulsed blue light in the presence of 100 μM IBMX from 14-18hpf.
(C) Immunofluorescence images of Gli:mCherry transgenic embryos either uninjected, or injected with mRNA encoding Nonciliary-bPAC or Cilia-bPAC. Embryos were stained for mCherry (greyscale). Embryos were either raised in the dark or stimulated with 0.35mW/cm2 470nm pulsed blue light from 14-18hpf and then allowed to develop until 24hpf. Scale bar, 40 μm.
(D) Quantification of Gli:mCherry-expressing cells per somite of uninjected embryos and those injected with mRNA encoding the indicated forms of bPAC. Each point represents the average number of mCherry-expressing cells over somites 12-15 of one embryo. Embryos were generated in three independent sets of injections. For both (B) and (D), significance was determined via two-way ANOVA with Tukey’s multiple comparison test. A p value less than 0.05 was considered statistically significant and is denoted as follows: ∗ < 0.05, ∗∗∗ < 0.001, and ∗∗∗∗ < 0.0001. Data are represented as means ± SD.
(E) Schematic of HH-dependent neural tube patterning. A gradient of Shh secreted from the notochord (NT) and medial floorplate (blue) patterns lateral floor plate cells expressing nkx2.2b (red) and motorneuron precursors expressing olig2 (yellow).
(F,G) Whole-mount in situ hybridization to detect neural tube markers in wild-type, Cyto-bPAC, and Cilia-bPAC-expressing transgenic zebrafish either raised in the dark or stimulated with blue light. Left panels depict views of lateral whole mount 24hpf embryos. Right panels depict transverse cross-sections. Dotted lines outline the neural tubes. Expression of nkx2.2b (F) and olig2 (G) are reduced specifically in Cilia-bPAC embryos stimulated with light. Scale bar, 40 μm.
Reprinted from Cell, 184(11), Truong, M.E., Bilekova, S., Choksi, S.P., Li, W., Bugaj, L.J., Xu, K., Reiter, J.F., Vertebrate cells differentially interpret ciliary and extraciliary cAMP, 2911-2926.e18, Copyright (2021) with permission from Elsevier. Full text @ Cell