
|
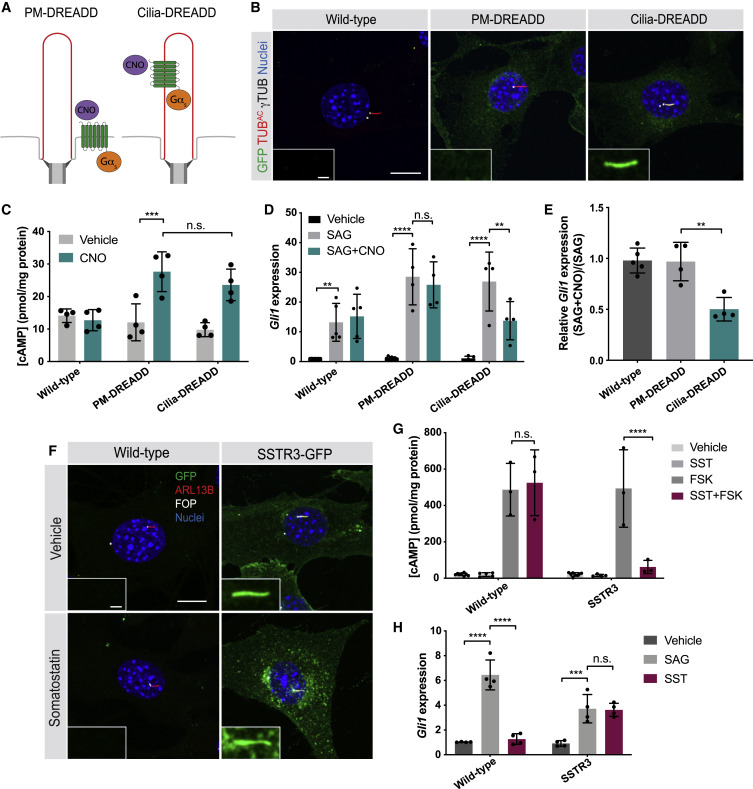
Fig. 4 (A) Schematic of tools to control a Gɑs-coupled designer GPCR at distinct subcellular locations. PM-DREADD localizes to the plasma membrane. Cilia-DREADD, a fusion with the ciliary protein ARL13B, localizes to cilia. These Gɑs-coupled DREADDs induce cAMP generation on stimulation with their ligand, the otherwise pharmacologically inert drug CNO. (B) Immunofluorescence imaging of wild-type and transgenic NIH/3T3 cells stably expressing GFP-tagged PM-DREADD or Cilia-DREADD. Images depict cells stained for the GFP-tagged DREADDs (GFP, green), cilia (TUBAC, red), basal bodies (γTUB, grayscale), and nuclei (Hoechst, blue). Insets indicate amount of GFP-tagged DREADD localization to the cilium (defined by TUBAC and γTUB). Scale bars, 10 μm and 1 μm (inset). (C) Quantification of cAMP in wild-type and PM-DREADD- or Cilia-DREADD-expressing NIH/3T3 transgenic cell lines. Cells were stimulated with either vehicle (DMSO) or 100 nM CNO in the presence of 10 μM IBMX for 3 h. cAMP concentration was determined by ELISA and normalized to total protein content. n = 4 biological replicates. Significance was determined via two-way ANOVA followed by Tukey’s multiple comparison test. Data are represented as means ± SD. (D) Expression of Gli1 by wild-type and PM-DREADD- or Cilia-DREADD-expressing cells stimulated with vehicle (DMSO), 200 nM SAG, or 200 nM SAG and 5 nM CNO for 5 h before measurement by qRT-PCR. n = 4–5 biological replicates. Significance was determined via one-way ANOVA followed by Tukey’s multiple comparison test. (E) Ratios of Gli1 expression in wild-type and PM-DREADD- or Cilia-DREADD-expressing cells treated with 200 nM SAG and 5 nM CNO to Gli1 expression treated with 200 nM SAG alone. Significance was determined via one-way ANOVA followed by Tukey’s multiple comparison test. n = 4–5 biological replicates. (F) Immunofluorescence imaging of wild-type and transgenic NIH/3T3 cells stably expressing SSTR3-GFP, a ciliary Gαi-coupled GPCR, fused to GFP. Images depict cells stained for SSTR3-GFP (GFP, green), cilia (ARL13B, red), basal bodies (FOP, grayscale), and nuclei (Hoechst, blue). Cells were treated either vehicle (DMSO) or 10 μM somatostatin (SST) for 5 h. Insets depict SSTR3-GFP localization to the cilium (defined by ARL13B and FOP). Scale bars, 10 μm and 1 μm (inset). (G) Quantification of SSTR3-mediated inhibition of cAMP production. Wild-type and SSTR3-GFP-expressing NIH/3T3 cells were stimulated with either vehicle (DMSO), 10 μM SST, 10 μM FSK, or 10 μM FSK and 10 μM SST in the presence of 10 μM IBMX for 30 min. cAMP concentration was measured by ELISA and normalized to total protein content. n = 3–6 biological replicates. Significance was determined via one-way ANOVA followed by Tukey’s multiple comparison test. Data are represented as means ± SD. (H) Expression of Gli1 by wild-type and SSTR3-GFP-expressing NIH/3T3 cells treated with vehicle (DMSO), 3 nM SAG, or 10 μM SST for 5 h and measured by qRT-PCR. n = 4 biological replicates. Significance was determined via one-way ANOVA followed by Tukey’s multiple comparison test. Data are represented as means ± SD. For all panels, a p value <0.05 was considered statistically significant and is denoted as follows: ∗p < 0.05, ∗∗p < 0.01, ∗∗∗p < 0.001, and ∗∗∗∗p < 0.0001.
Reprinted from Cell, 184(11), Truong, M.E., Bilekova, S., Choksi, S.P., Li, W., Bugaj, L.J., Xu, K., Reiter, J.F., Vertebrate cells differentially interpret ciliary and extraciliary cAMP, 2911-2926.e18, Copyright (2021) with permission from Elsevier. Full text @ Cell