
- Title
-
A globin-family protein, cytoglobin 1, is involved in the development of neural crest-derived tissues and organs in zebrafish
- Authors
- Takahashi, K., Ito, Y., Yoshimura, M., Nikaido, M., Yuikawa, T., Kawamura, A., Tsuda, S., Kage, D., Yamasu, K.
- Source
- Full text @ Dev. Biol.
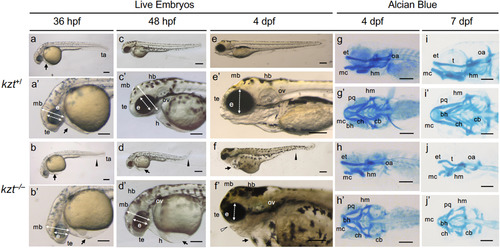
Diverse morphological defects are observed in kanazutsi (kzt) embryos. (a–f, a’–f’) Live images of kzt homozygotes (kzt–/–) and siblings (kzt+/) at 36 h post-fertilization (hpf), 48 hpf, and 4 days post-fertilization (dpf). kzt–/– embryos are characterized by bending of the body axis (arrowhead), swelling of the pericardial cavity (arrow), dwarf eyes (e, two-headed broken arrows), and flattening of the head (two-headed arrows). These phenotypes were more prominent at 4 dpf, and dysplasia of the upper and lower jaws was also observed (open arrowhead). Images are lateral views with anterior to the left and dorsal to the top. (g–j, g’–j’) Cartilage formation in kzt homozygotes (kzt–/–) and sibling embryos (kzt+/). Lateral views (g–j) and dorsal views (g’–j’) of embryos stained with Alcian blue show the defects in cranial cartilage development in kzt homozygotes. Regression of Meckel’s cartilage (mc) and ceratobranchial (cb) was remarkable, whereas ceratohyal (ch) was relatively normal. In addition, the angle between the left and right palatoquadrate cartilage (pq) in kzt mutants was obtuse compared to that in siblings. bh, basihyal; e, eye; et, ethmoid; h, heart; hb, hindbrain; hm, hyomandibular; mb, midbrain; oa, occipital arc; ov, otic vesicle; t, trabeculae; ta, tail, te, telencephalon. Scale bars, 200 μm. |
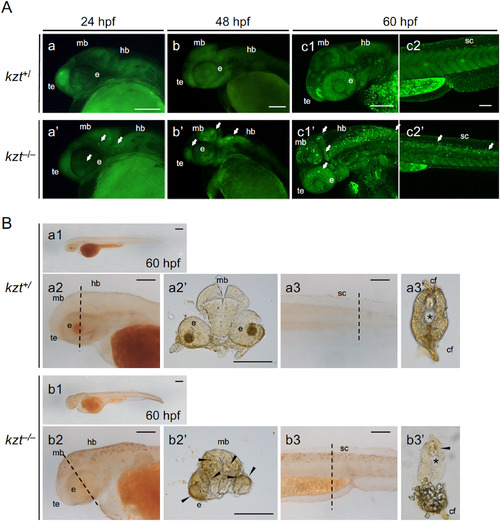
Increased cell death in the central nervous system of kzt embryos. (A) Acridine orange (AO) staining shows abundant cell death in kzt embryos. Offspring obtained by mating kzt heterozygotes were stained at 24 hpf, 48 hpf, and 60 hpf with AO, which stains apoptotic cells as bright spots. Lateral views of the heads (a, b, c1, a’, b’, c1’) and trunk-tail regions (c2, c2’) of kzt+/and kzt–/– embryos are shown, anterior to the left and dorsal to the top. Cell death was detected in the midbrain (mb), hindbrain (hb), optic vesicles (eye, e), telencephalon (te), and spinal cord (sc) of kzt homozygotes (arrows). During the course of development, AO staining became progressively more striking in kzt embryos, whereas it began to be weakly detected in wild-type siblings only after 60 hpf. (B) Terminal deoxynucleotidyl transferase dUTP nick end labeling (TUNEL) confirmed the increased apoptotic cells in kzt embryos. kzt–/– or sibling embryos (kzt+/) were stained at 60 hpf using the TUNEL method. Lateral views of whole embryos (a1, b1), heads (a2, b2), and the trunk-tail region (a3, b3) are shown, with anterior to the left. (a2’, a3’, b2’, b3’) Cross-sections of stained embryos were from the positions marked in lateral views with dotted lines (a2, a3, b2, b3, respectively). As with AO staining, apoptotic cells were intensely detected only in kzt homozygotes (arrowheads in cross-sections). cf, caudal fin; e, optic vesicle; hb, hindbrain, mb, midbrain; sc, spinal cord; te, telencephalon; ∗, notochord. Scale bars, 200 μm. |
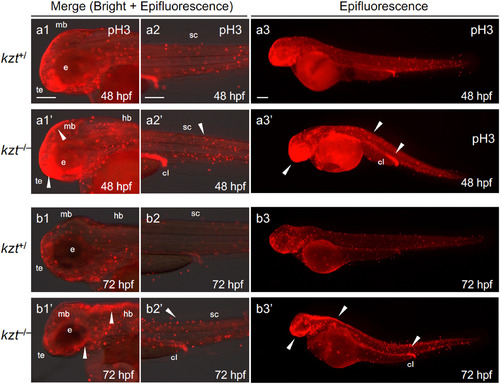
Cell proliferation is increased in kzt embryos. kzt homozygotes (kzt–/–) or sibling embryos (kzt+/) were immunostained for phosphorylated histone H3 (pH3) at 48 hpf or 72 hpf. Epifluorescence images or those merged with bright-field images are shown. Images are lateral views of the heads (a1/a1’, b1/b1’), trunk-tail regions (a2/a2’, b2/b2’), and whole embryos (a3/a3’, b3/b3’), with anterior to the left and dorsal to the top. Higher numbers of proliferative cells (stained red) were found throughout kzt homozygote embryos (arrowheads), including the brain at both 48 hpf and 72 hpf. cl, cloaca; e, optic vesicle; hb, hindbrain, mb, midbrain; sc, spinal cord; te, telencephalon. Scale bars, 200 μm. PHENOTYPE:
|
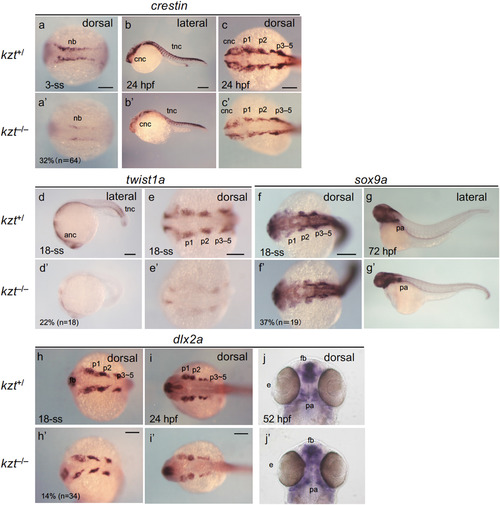
Development of neural crest cells is severely affected in kzt embryos. Offspring from crosses between kzt heterozygotes (kzt+/–) were stained for the expression of neural crest cell (NCC) marker genes. Lateral views are shown with anterior to the left and dorsal to the top, whereas dorsal views are with anterior to the left except for the last two (j, j’), in which anterior is to the top. As little morphological disorder was recognized until late somitogenesis, kzt+/– phenotypes were assessed based on whether their ratios were approximately one-quarter. The percentages of abnormal embryos and total embryo numbers examined are shown at the bottom left. After 24 hpf, sibling embryos (kzt+/–) and homozygotes (kzt–/–) were identified morphologically. anc, anterior neural crest; cnc, cranial neural crest; fb, forebrain; nb, neural plate border; pa, pharyngeal arches; p1–5, pharyngeal arch 1–5; tnc, trunk neural crest cell. Scale bars, 200 μm. EXPRESSION / LABELING:
PHENOTYPE:
|
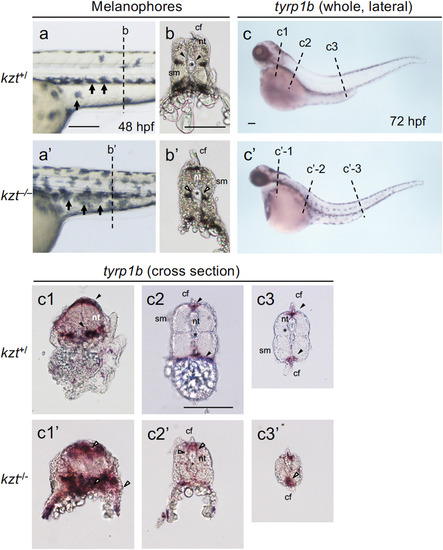
Migration and pattern formation of melanophores are abnormal in kzt embryos. (a, b, a’, b’) Distribution of melanophores in sibling (kzt+/) and homozygous (kzt–/–) embryos. (a, a’) Lateral views of the trunks with anterior to the left and dorsal to the top, showing the distribution of melanophores (small arrows) at 48 hpf. (b’, b’) Cross-sections of fixed embryos at positions corresponding to the broken lines in (a) and (a’), respectively, showing melanophore distribution within embryonic bodies. In wild-type embryos, melanophores were absent in the vicinity (solid arrowheads) of the notochord (asterisk), whereas they were distributed on the surface of the notochord in kzt mutants (open arrowheads). (c, c’) The expression of tyrp1b localized by whole-mount in situ hybridization (WISH), identifying melanophores in sibling embryos (c, kzt+/–) and homozygotes (c’, kzt–/–). (c1–c3, c1’–c3’) Cross-sections of stained embryos at positions corresponding to the broken lines in (c) and (c’), respectively, showing melanophore distribution (arrowheads). In wild-type embryos, melanophore distribution was restricted beneath the epidermis and in the dorsal-most and ventral-most regions (solid arrowheads), whereas melanophores were abnormally distributed on the surface of the notochord and within embryos in a dorsoventrally broad manner in kzt mutants (open arrowheads). cf, caudal fin; nt, neural tube; sm, somite; ∗, notochord. Scale bars, 200 μm. |
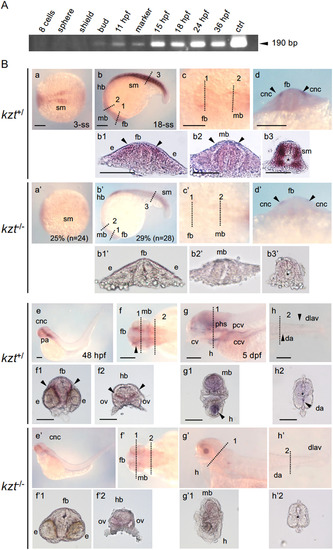
Expression of cygb1 during zebrafish development. (A) The expression of cygb1 from the cleavage stage to 36 hpf in wild-type zebrafish embryos was examined by reverse transcription (RT)-PCR. The expected size of the product was 190 bp (arrowhead). ctrl, PCR product amplified from cygb1 cDNA plasmid. cygb1 expression increased from the bud stage to 15 hpf, plateauing thereafter. (B) cygb1 expression in embryos obtained from crosses of kzt heterozygotes was detected by WISH after the 3-somite stage (3-ss). (a, c, f, a’, c’, f’) Dorsal views with anterior to the left. (b, e, g, h, b’, e’, g’, h’) Lateral views with anterior to the left and dorsal to the top. (d, d’) Frontal views with dorsal to the top. At 3-ss and 18-ss, kzt homozygotes were difficult to identify morphologically, thus abnormal expression observed in a quarter of embryos was considered that of homozygotes. In these cases, the percentages of embryos with the expression shown and the numbers of total embryos examined are shown at the bottom. Cross-sectional views at the positions marked in (b/b’, c/c’, f/f’–h/h’) with dashed lines are shown below the corresponding panels. cygb1 expression (arrowheads) was extensively downregulated in kzt homozygotes at all stages examined. cnc, cranial neural crest cells; ccv, common cardinal vein; cv, cranial vessels; da, dorsal aorta; dlav, dorsal longitudinal anastomotic vessel; e, optic vesicle; fb, forebrain; h, heart; hb, hindbrain; mb, midbrain; ov, otic vesicle; pa, pharyngeal arch; pcv, posterior cardinal vein; phs, posterior head sinus; sm, somite; ∗, notochord. Scale bars, 200 μm. EXPRESSION / LABELING:
PHENOTYPE:
|
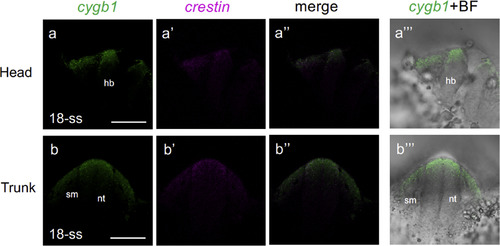
Coexpression of cygb1 and crestin in neural crest cells. The expression of cygb1 (green; a, b) and crestin (magenta; a’, b’) in the head (top row) and trunk (bottom row) neural tube was stained by 2-FISH at 18-ss, showing that cygb1 is expressed in neural crest cells. Transverse views with dorsal to the top. hb, hindbrain; nt, neural tube; sm, somite. a’’ & b’’, merged views. a’’’ & b’’’, bright field views (BF) are superimposed on cygb1 expression. Scale bar, 100 μm. EXPRESSION / LABELING:
|
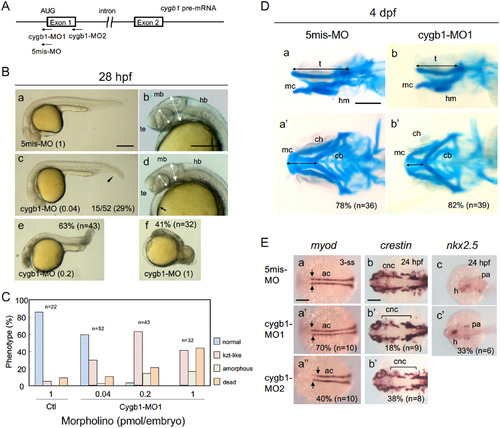
Knockdown of cygb1 phenocopied the kzt mutation. (A) Morpholino oligos were designed against the translational start codon (cygb1-MO1) and the donor site at the exon 1-intron 1 junction (cygb1-MO2). As a negative control, cygb1-MO1 with five mismatches was used in parallel (5mis-MO). (B) Embryos injected with 5mis-MO at 1 pmol/embryo (a, b) and cygb1-MO1 at 0.04 pmol/embryo (c, d), 0.2 pmol/embryo (e), and 1 pmol/embryo (f) were observed at 28 hpf. cygb1-MO1 at 0.04 pmol/embryo caused head flattening (two-headed arrows), small eyes (two-headed broken arrows), trunk-tail bending (arrowhead), and heart edema (arrow), thus phenocopying the kzt mutation. A higher concentration (1 pmol/embryo) resulted in phenotypes much more severe than those of kzt embryos, whereas 5mis-MO1 resulted in few anomalies. (C) Dose-dependent effects of cygb-MO1 on development. Embryos with normal morphology, kzt-phenotypes, amorphous embryos, and death were scored at different doses of cygb1-MO1. (D) Development of the cranial cartilage in embryos injected with morpholino oligos. Cranial cartilage was stained with Alcian blue in embryos injected with 5mis-MO (a, a’) or cygb1-MO1 (b, b’). (E) Knockdown of cygb1 resulted in molecular effects in embryos similar to those of the kzt mutation. The expression of myod in adaxial cells and crestin in NCCs was examined in embryos injected with 5mis-MO (a–c), cygb1-MO1 (a’–c’), or cygb1-MO2 (a’’, b’’). The pattern of myod expression was particularly affected in the anterior adaxial cells (arrows), and crestin expression was particularly decreased in pharyngeal arch-derived cartilage (brackets). (B, Da, Db) Lateral views with anterior to the left and dorsal to the top. (Da’, Db’, E) Dorsal views with anterior to the left. Percentages of abnormal embryos and the numbers of embryos examined are shown at the bottom right or at the top right. ac, adaxial cell; ch, ceratohyal; cb, ceratobranchial; cnc, cranial neural crest cell; h, heart; hb, hindbrain; hm, hyomandibular; mb, midbrain; mc, Meckel’s cartilage; pa, pharyngeal arch; t, trabecula, te, telencephalon. Scale bars, 200 μm (B, E) or 100 μm (D). EXPRESSION / LABELING:
PHENOTYPE:
|
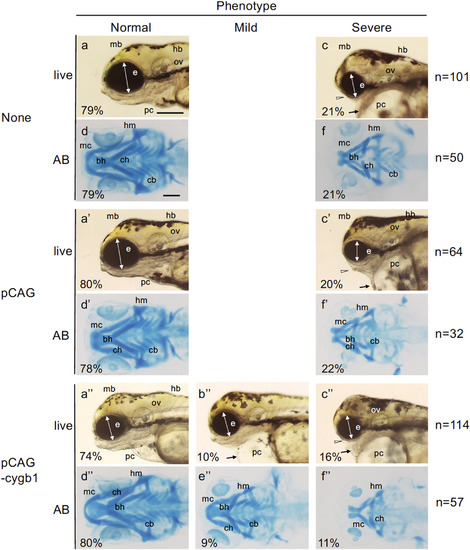
kzt phenotypes are rescued by overexpression of cygb1. Offspring embryos of matings between kzt heterozygotes were raised without plasmid injection (none, a–f), or injected with either pCAG (a’–f’, 20 pg/embryo) or pCAG-cygb1 (a’’–f’’, 20 pg/embryo). Heads of live embryos (live) or those stained with Alcian blue (AB) were observed at 4 dpf, and classified as normal (Normal), kzt-type mild (Mild), or kzt-type severe (Severe) phenotypes. Percentages of the respective observed phenotypes are shown at the bottom left, and the numbers of total embryos observed are shown on the right for each experimental group. Mild phenotypes were observed only when cygb1 was overexpressed. kzt-type phenotypes are indicated with arrows (heart), arrowheads (jaws), or two-headed white arrows (eyes). These data are included in Table 2 and Supplementary Fig. S11. bh, basihyal; cb, ceratobranchial; ch, ceratohyal; e, optic vesicle; hm, hyomandibular; mb, midbrain; mc, Meckel’s cartilage; ov, otic vesicle; pc, pericardial cavity. Scale bars, 200 μm. |

ZFIN is incorporating published figure images and captions as part of an ongoing project. Figures from some publications have not yet been curated, or are not available for display because of copyright restrictions. |
|
Unillustrated author statements PHENOTYPE:
|
Reprinted from Developmental Biology, 472, Takahashi, K., Ito, Y., Yoshimura, M., Nikaido, M., Yuikawa, T., Kawamura, A., Tsuda, S., Kage, D., Yamasu, K., A globin-family protein, cytoglobin 1, is involved in the development of neural crest-derived tissues and organs in zebrafish, 1-17, Copyright (2020) with permission from Elsevier. Full text @ Dev. Biol.