FIGURE SUMMARY
Title

Machine learning discriminates a movement disorder in a zebrafish model of Parkinson's disease

Authors
Hughes, G.L., Lones, M.A., Bedder, M., Currie, P.D., Smith, S.L., Pownall, M.E.
Source
Full text @ Dis. Model. Mech.

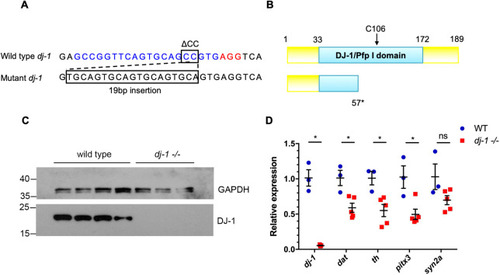
The zebrafishdj-1−/− mutation is a genetic null. (A) Wild-type dj-1 target sequence in the zebrafish genome (top). The 20 bp target sequence (blue) is directly upstream of a 3 bp protospacer adjacent motif (PAM) site (red). A 2 bp deletion (ΔCC) followed by a 19 bp insertion in the target sequence causes a frameshift mutation in dj-1 (bottom). (B) Comparison of the protein structure for wild-type Dj-1 (top), with essential residue C106 indicated, and the predicted mutant protein truncated at residue 57 (bottom). (C) Western blot analysis of Dj-1 protein expression in the brains of wild-type adult zebrafish (lanes 1-4) and their dj-1−/− mutant siblings (lanes 5-7). Gapdh was used as a loading control. (D) qRT-PCR analysis (single replicate) comparing gene expression in brains extracted from wild-type adult zebrafish (n=3, biological replicates) and their dj-1−/− mutant siblings (n=5) at 16 weeks post-fertilisation (wpf). Target gene dj-1 was analysed alongside DA neuron markers dopamine transporter (dat), tyrosine hydroxylase (th) and pituitary homeobox 3 (pitx3); synapsin IIa (syn2a) acted as a general synapse marker. Student’s t-tests (two-tailed, unpaired) were used to compare the dCt values for dj-1−/− and wild-type samples. Data are mean±s.e.m., *P<0.05; ns, not significant.

EXPRESSION / LABELING:
Genes:
Antibody:
Fish:
Anatomical Term:
Stage: Adult
PHENOTYPE:
Fish:
Observed In:
Stage: Adult

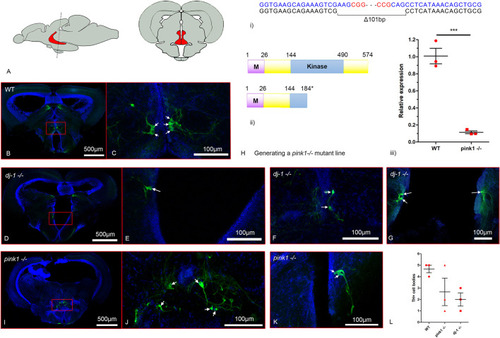
Reduction of dopaminergic neurons in the posterior tuberculum of PD zebrafish. Immunohistochemical detection of Tyrosine hydroxylase (Th) in dj-1−/− and pink1−/− brains. A section through the posterior tuberculum (pT) was identified based on the shape of the brain according to Wulliman et al. (1996). The large pear-shaped Th-positive cells located next to the ventricle in the pT have previously been identified as part of the zebrafish dopaminergic system projecting to the striatum (Rink and Wullimann, 2001). Therefore, the pear-shaped Th-positive cells identified in the periventricular pT location were counted. (A) Lateral view of the adult zebrafish brain (left) and cross-section through the adult zebrafish brain (right). Highlighted in red is the pT. (B-G,I-K) Immunofluorescently labelled Th-positive cells (green) in the pT of wild-type, dj-1−/− and pink1−/− zebrafish (n=3 biological replicates) at 12 months post-fertilisation (mpf). Hoechst staining of nuclei is in blue. Arrows indicate the cell bodies of the paraventricular DA neurons. (B) Th-positive cells in a section through the pT (red box) of a wild-type brain. (C) A close-up of the Th-positive cells in the pT from A. (D) Th-positive cells in a section through the pT (red box) of a dj-1−/− brain. (E) A close-up of the Th-positive cells in the pT from D. (F,G) Close-ups of Th-positive cells in the pT of two further dj-1−/− brains. (H)(i) CRISPR/Cas9 target sequences (blue), PAM sites (red) and the 101 bp deletion generated in exon 2 of pink1 (at position 591 of NM_001008628). (ii) Wild-type Pink1 (above) and the truncated Pink1 protein (below) predicted in the pink1 mutant. (iii) qRT-PCR analysis comparing pink1 expression in brains extracted from pink1−/− zebrafish (n=4, biological replicates) and their wild-type siblings (n=3) at 16 wpf. Student’s t-tests (two-tailed, unpaired) were used to compare the dCt values for pink1−/− and wild-type samples. Data are mean±s.e.m., ***P<0.001. (I) Th-positive cells in a section through the pT (red box) of a pink1−/− brain. (J) A close-up of the Th-positive in the pT from I. (K) A close-up of the Th-positive cells in the pT of a further pink1−/− brain. (L) Counts of Th-positive cell bodies seen in the pT (single 100 µm section) for wild-type, dj-1−/− and pink1−/− zebrafish (n=3 biological replicates) at 12 mpf.

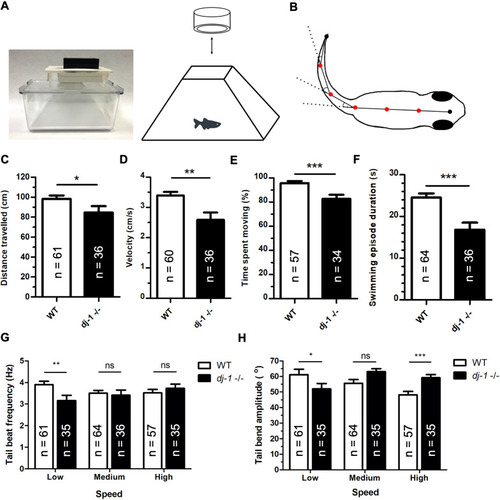
Analysis of extracted features reveals distinct movement in dj-1−/− zebrafish. (A) A photograph of the frustum insert designed to fit an Aquatics Habitat mating tank with a GoPro camera attached (left), providing a simple system for accurate, high-resolution video capture of adult zebrafish movement. A diagram of the fish inside the frustrum insert, recorded from above using the GoPro camera (right). (B) A diagram of the angles measured along the zebrafish trace, at the five vertices (red dots), when there is a bend in the tail. x and y coordinates were measured for the vertices and endpoints. Measurements were recorded at 100 frames/s from the video input, allowing analysis of selected features of movement. (C-H) The features of movement compared between dj-1−/− and wild type (WT) at 12 wpf including distance travelled (C), velocity (D), percentage of time spent moving (E), mean duration of a swimming episode (F), tail beat frequency at low, medium and high swimming speeds (G), and tail bend amplitude at low, medium and high swimming speeds (H) (single replicate). The number of replicates (n) is shown for each graph. Student’s t-tests (two-tailed, unpaired) were used to compare features that followed a normal distribution; the Mann–Whitney U-test (two-tailed) was used to compare non-parametric features. Data are mean± s.e.m., *P<0.05, **P<0.01, ***P<0.001; ns, not significant.

PHENOTYPE:
Fish:
Observed In:
Stage: Adult

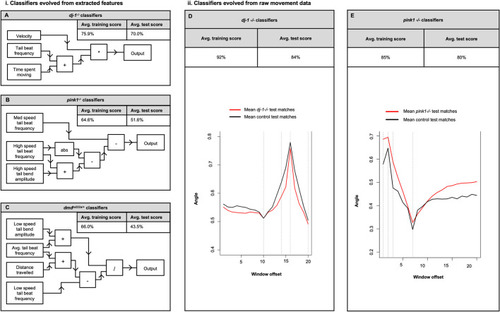
Machine learning evolves classifiers from movement data and discriminates dj-1−/− zebrafish as distinct from controls. (i)(A-C) An analysis using an evolutionary algorithm to discriminate a classifier by analysing extracted features of movement. (A) The mean training and test scores for classifiers evolved to recognise dj-1−/− zebrafish (n=30) at 12 wpf over 20 folds of datasets containing extracted features of movement. The CGP network of the highest scoring dj-1−/− classifier evolved using the extracted features is depicted as a flow diagram. (B) The mean training and test scores for classifiers evolved to recognise pink1−/− zebrafish (n=37) at 14 wpf over 20 folds of dataset containing extracted features of movement. The CGP network of the highest-scoring pink1−/− classifier evolved using the extracted features is depicted as a flow diagram. (C) The mean training and test scores for classifiers evolved to recognise dmdta222a/+ zebrafish (n=25) at 12 wpf over 20 folds of dataset containing extracted features of movement. The CGP network of the highest-scoring dmdta222a/+ classifier evolved using the extracted features is depicted as a flow diagram. (ii)(D,E) A separate analysis of the raw movement data using sliding window classifiers trained with the PC2 time series data to generate symbolic mathematical expressions that describe discriminatory local patterns of movement within the data. (D) The training and test accuracies for the classifier evolved to recognise dj-1−/− zebrafish at 12 wpf. Mean plots of the PC2 time series data in the 20 windows most useful for discriminating dj-1−/− mutants (n=36) (red) and age-matched controls (n=64) (black) in the test dataset. (E) The training and test accuracies for the classifier evolved to recognise pink1−/− zebrafish at 14 wpf. Mean plots of the PC2 time series data in the 20 windows most useful for discriminating pink1−/− mutants (n=39) (red) and age-matched controls (n=44) (black) in the test dataset.

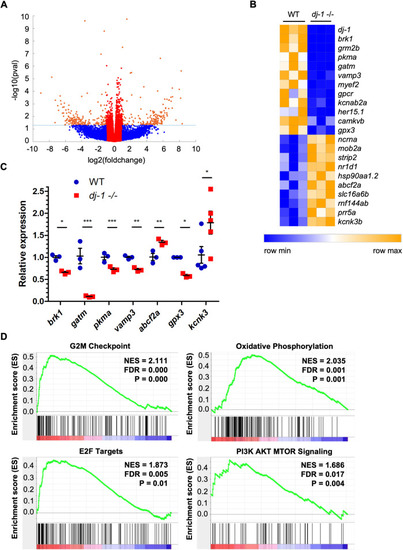
Differential gene expression in thedj-1−/− mutant brain. (A) A volcano plot representing the global changes in gene expression observed by RNA-seq analysis, comparing RNA from the brains of dj-1−/− mutants (n=3, biological replicates) and their wild-type siblings (n=3) at 16 wpf. The fold change (log2) of each transcript was plotted against the P-value (−log10). Transcripts in red are down/upregulated less than 2-fold. Transcripts in orange that appear above the dotted line are differentially expressed with a P-value of <0.05 and down/upregulated more than 2-fold. Transcripts in blue have a P-value of ≥0.05. (B) A heatmap showing select genes differentially expressed with an FDR q-value of <0.05. Relative expression is represented on a colour scale from blue (low) to orange (high). (C) qRT-PCR analysis validating the results seen in the RNA-seq using RNA extracted from the brains of dj-1−/− and wild-type siblings at 16 wpf (n=3 for all but n=5 for kcnk analysis, biological replicates). Student's t-tests (two-tailed, unpaired) were used to compare the dCt values for dj-1−/− and wild-type samples. Data are mean±s.e.m., *P<0.05, **P<0.01, ***P<0.001. (D) GSEA enrichment plots for Hallmark gene sets: G2M checkpoint, oxidative phosphorylation, E2F transcription factors and PI3K/AKT/mTOR signalling. FDR, false discovery rate-adjusted P-value; NES, normalised enrichment score; P, nominal P-value. Data have been deposited in GEO, accession number GSE135271.

Acknowledgments
This image is the copyrighted work of the attributed author or publisher, and ZFIN has permission only to display this image to its users. Additional permissions should be obtained from the applicable author or publisher of the image. Full text @ Dis. Model. Mech.