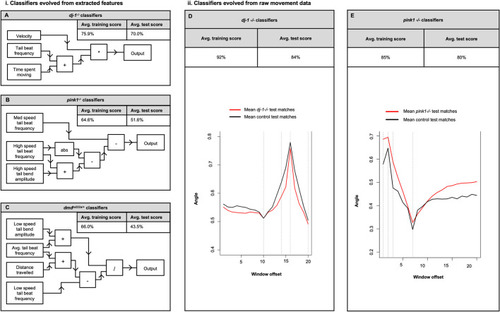
Machine learning evolves classifiers from movement data and discriminates dj-1−/− zebrafish as distinct from controls. (i)(A-C) An analysis using an evolutionary algorithm to discriminate a classifier by analysing extracted features of movement. (A) The mean training and test scores for classifiers evolved to recognise dj-1−/− zebrafish (n=30) at 12 wpf over 20 folds of datasets containing extracted features of movement. The CGP network of the highest scoring dj-1−/− classifier evolved using the extracted features is depicted as a flow diagram. (B) The mean training and test scores for classifiers evolved to recognise pink1−/− zebrafish (n=37) at 14 wpf over 20 folds of dataset containing extracted features of movement. The CGP network of the highest-scoring pink1−/− classifier evolved using the extracted features is depicted as a flow diagram. (C) The mean training and test scores for classifiers evolved to recognise dmdta222a/+ zebrafish (n=25) at 12 wpf over 20 folds of dataset containing extracted features of movement. The CGP network of the highest-scoring dmdta222a/+ classifier evolved using the extracted features is depicted as a flow diagram. (ii)(D,E) A separate analysis of the raw movement data using sliding window classifiers trained with the PC2 time series data to generate symbolic mathematical expressions that describe discriminatory local patterns of movement within the data. (D) The training and test accuracies for the classifier evolved to recognise dj-1−/− zebrafish at 12 wpf. Mean plots of the PC2 time series data in the 20 windows most useful for discriminating dj-1−/− mutants (n=36) (red) and age-matched controls (n=64) (black) in the test dataset. (E) The training and test accuracies for the classifier evolved to recognise pink1−/− zebrafish at 14 wpf. Mean plots of the PC2 time series data in the 20 windows most useful for discriminating pink1−/− mutants (n=39) (red) and age-matched controls (n=44) (black) in the test dataset.
|
