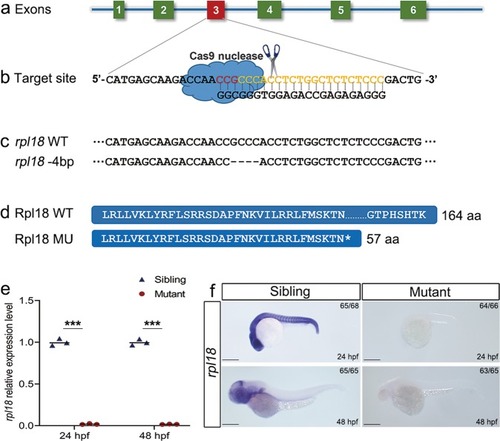
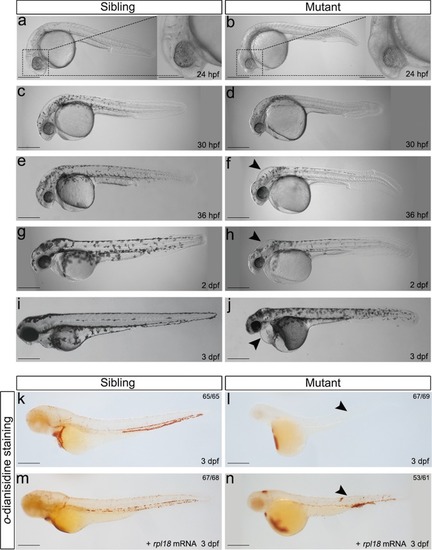
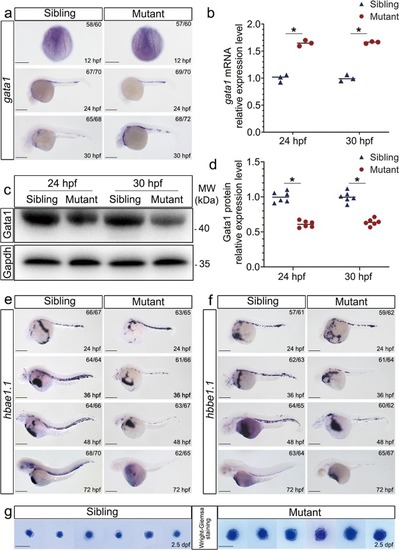
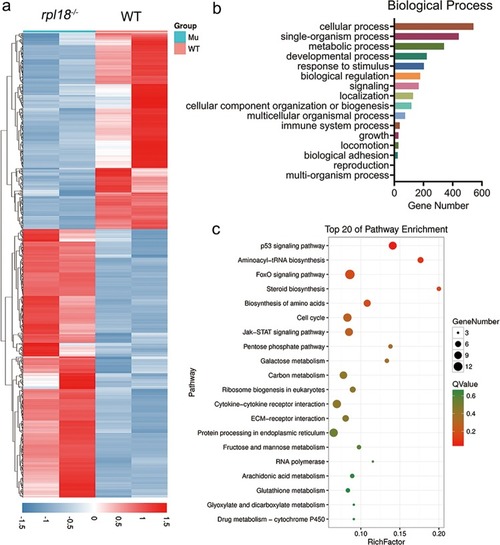
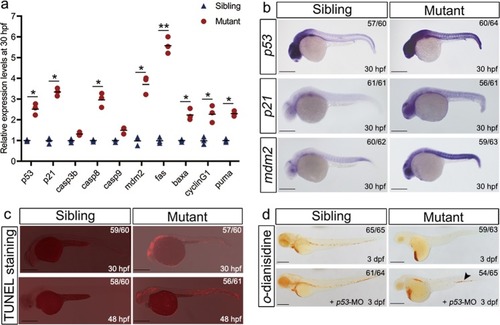
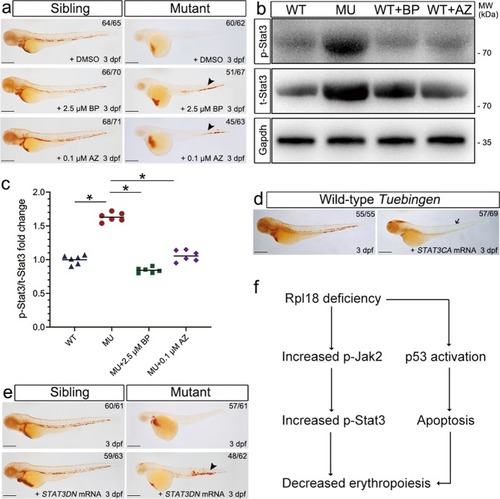
Generation of <italic>rpl18</italic> mutation using CRISPR/Cas9 system.

a, b Illustration describing the target site of rpl18. c, d Genomic sequences and predicted protein sequences based on the DNA sequence in wild-type and rpl18−/− mutants. e qRT-PCR of rpl18 transcript levels of wild-type siblings and rpl18−/− mutants at 24 and 48 hpf. qRT-PCR experiments were performed biological repeats and technical repeats in triplicate (N = 3). ***P < 0.001. f WISH results for rpl18 in siblings and mutants at 24 and 48 hpf, WISH results were verified three times independently (N = 3). All scale bars represent 250 μm.

Rpl18-deficient embryos displayed physical abnormalities and anemia.

aj Phenotypes of wild-type siblings and rpl18−/− mutants (N = 7). At 24 hpf (a, b), aplasia of head region (dashed box) can be seen in mutant. At 30 hpf (c, d), pigmentation was delayed. At 36 hpf (e, f) and 2 dpf (g, h), a smaller head and edema (arrowhead) were present. At 3 dpf (i, j), edema (arrowhead) in heart and shorted tail extension was more apparent. Almost all embryos died at 4 dpf. k, lo-dianisidine staining showed depletion of erythroid cells in rpl18−/ embryos compared with wild-type siblings (arrowheads pointed to the sites of weak o-dianisidine staining, N = 5). m, nrpl18 mRNA (100 pg/embryo) injected to embryos, staining of 3 dpf mutants with o-dianisidine showed a partial recovery (N = 3). All scale bars represent 250 μm.

Rpl18 deficiency impaired the erythroid maturation.

a WISH showed that expression levels of gata1 in rpl18−/− embryos was slightly increased at 24 and 30 hpf (N = 3). b Relative expression of gata1 mRNA was analyzed by qRT-PCR for rpl18 siblings and mutants (N = 3). *P < 0.05. c Western blot (WB) analysis was performed to determine Gata1 protein level. WB with Gata1 antibody demonstrated its reduction in rpl18−/ mutants at 24 and 30 hpf. d The scatter diagram represented quantification of WB. Compared with siblings, the expression of Gata1 protein in mutants decreased by about 40%. The results of three groups of experiments (each experiment was repeated twice) were statistically analyzed, *P < 0.05. WISH showed that expression levels of hbae1.1 (e) and hbbe1.1 (f) in mutants were unaffected at 24 hpf, but reduced significantly from 36 hpf (N = 3). Scale bars represent 250 μm. g Wright–Giemsa staining of isolated erythroid cells collected from zebrafish embryos at 2.5 dpf. The nucleoli size of erythrocyte in rpl18 mutants was much larger than siblings (N = 4). Scale bars represent 10 μm.

Differential gene expression profile, gene ontology, and pathway enrichment analysis for <italic>rpl18</italic> mutants and siblings.

a The heat map of the differential gene expression profile for rpl18/ embryos and siblings assessed by transcriptome sequencing. b The gene ontology (GO) enrichment analysis of biological process indicated that differentially expressed genes occurred in these processes. c Pathway enrichment analysis identified the top 20 of pathway affected in mutants.

Upregulation of p53 activity partially contributed to the erythroid phenotype in <italic>rpl18</italic> mutants.

a Transcript quantification of p53 and p53 related genes were verified by qRT-PCR. All the p53 related genes were highly expressed in rpl18 mutants at 30 hpf (N = 3), *P < 0.05. **P < 0.01. b WISH showed that p53, p21, and mdm2 expression was elevated in rpl18 mutants at 30 hpf (N = 3). c In situ cell death staining result showed that the signal of apoptosis can be observed thought the body at 30 and 48 hpf (N = 4). d An increase of hemoglobin level appeared in mutants at 3 dpf after p53 knockdown (N = 3). Arrowhead points to the recovery of erythrocytes. All scale bars represent 250 μm.

Inhibition of the phosphorylation of Jak2 or Stat3 rescued hemoglobin level in <italic>rpl18</italic> mutants.

arpl18 sibling and mutant embryos were treated with BP (T3708, STAT3 inhibitor) or AZ (T6309, JAK2 inhibitor) (N = 5). At 3 dpf, o-dianisidine staining of mutant embryos showed obvious recovery with BP (2.5 μM) treatment, and mutants treated with AZ (0.1 μM) also be seen partially restored (arrowhead). b The total amounts of Stat3 (t-Stat3) and the phosphorylation status of endogenous Stat3 protein (p-Stat3) was evaluated in rpl18 siblings and mutants. The protein levels of t-Stat3 and p-Stat3 had a significant increase in mutants, compared with wild-type (WT) embryos at 30 hpf. Both the t-Stat3 and p-Stat3 were dramatically decreased in Rpl18-deficient embryos treated with BP or AZ separately, as shown by western blotting. c The scatter diagram represented quantification of western blots. The results of three groups of experiments (twice technical repeated for each group) were statistically analyzed, *P < 0.05. d The o-dianisidine staining displayed that most of erythroid cells disappeared (arrow) in wild-type embryos after injection the STAT3CA (constitutively active STAT3 with the double mutation A661C N663C) mRNA, compared with sibling embryos at 3 dpf (N = 3). e Erythrocytes were partially rescued in rpl18 mutants that had been injected with STAT3DN (dominant-negative STAT3) mRNA at 3 dpf (N = 3). Black arrowhead points to the recovery of erythrocytes. f Model of the defective erythroid maturation in Rpl18 deficiency through increased phosphorylated Stat3 expression. All scale bars represent 250 μm.

ZFIN is incorporating published figure images and captions as part of an ongoing project. Figures from some publications have not yet been curated, or are not available for display because of copyright restrictions.

EXPRESSION / LABELING:
Gene:
Fish:
Anatomical Terms:
Stage Range: 1-cell to Protruding-mouth

ZFIN is incorporating published figure images and captions as part of an ongoing project. Figures from some publications have not yet been curated, or are not available for display because of copyright restrictions.

EXPRESSION / LABELING:
Genes:
Fish:
Anatomical Term:
Stage Range: Prim-15 to Long-pec

ZFIN is incorporating published figure images and captions as part of an ongoing project. Figures from some publications have not yet been curated, or are not available for display because of copyright restrictions.

ZFIN is incorporating published figure images and captions as part of an ongoing project. Figures from some publications have not yet been curated, or are not available for display because of copyright restrictions.

EXPRESSION / LABELING:
Genes:
Fish:
Anatomical Term:
Stage: Prim-15
PHENOTYPE:
Fish:
Observed In:
Stage: Prim-15

ZFIN is incorporating published figure images and captions as part of an ongoing project. Figures from some publications have not yet been curated, or are not available for display because of copyright restrictions.

ZFIN is incorporating published figure images and captions as part of an ongoing project. Figures from some publications have not yet been curated, or are not available for display because of copyright restrictions.

Acknowledgments
This image is the copyrighted work of the attributed author or publisher, and ZFIN has permission only to display this image to its users. Additional permissions should be obtained from the applicable author or publisher of the image. Full text @ Cell Death Dis.