
- Title
-
Hemodynamic-mediated endocardial signaling controls in vivo myocardial reprogramming
- Authors
- Gálvez-Santisteban, M., Chen, D., Zhang, R., Serrano, R., Nguyen, C., Zhao, L., Nerb, L., Masutani, E.M., Vermot, J., Burns, C.G., Burns, C.E., Del Álamo, J.C., Chi, N.C.
- Source
- Full text @ Elife
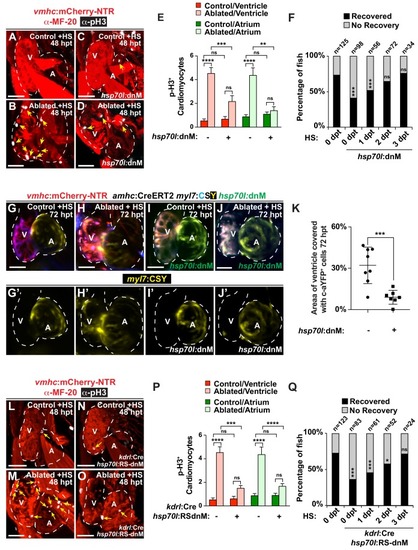
Endocardial Notch signaling controls myocardial reprogramming and cardiac regeneration. (A–D, L–O) Confocal microscopy imaging of heat-shocked/HS (A, B, L, M) vmhc:mCherry-NTR, (C, D) vmhc:mCherry-NTR; hsp70l:dnM and (N, O) vmhc:mCherry-NTR; kdrl:Cre; hsp70l:RS-dnM hearts reveals that (D) global or (O) endocardial-specific dnMAML (dnM) Notch inhibition inhibits CM proliferation in ventricle-ablated hearts at 48 hpt (7 dpf) when compared to (B, M) CM proliferation in control ventricle-ablated (no dnMAML) hearts. White – anti-phospho-histone H3 immunostaining; red – anti-MF-20 immunostaining. Arrows point to proliferating CMs. (E, P) Quantitation of anti-phospho-histone H3+ CMs in these hearts confirms that (E) global or (P) endocardial-specific dnM Notch inhibition prevents CMs from proliferating in injured hearts (n = 23, control dnM-; 31, MTZ dnM-; 10, control dnM+; 18, MTZ dnM+; 16, control RSdnM-; 16, MTZ RSdnM-; 15, Control RSdnM+; 15, MTZ RSdnM-). Red bars – ventricle; green bars – atrium; dark bars – control sham-ablated hearts; light bars – ventricle-ablated hearts. (F, Q) Quantitation of the percentage of heat-shocked vmhc:mCherry-NTR, vmhc:mCherry-NTR; hsp70l:dnM and vmhc:mCherry-NTR; kdrl:Cre; hsp70l:RS-dnM ventricle-ablated hearts that display recovered ventricular tissue and contractility (black bars) at 96 hpt (nine dpf) shows that (F) global or (Q) endocardial-specific Notch inhibition between 0 and 1 dpt leads to the greatest inhibitory effect on overall recovery from ventricle injury. The number of fish analyzed for each condition is indicated above each column. (G–K) To examine the effects of Notch signaling on cardiac reprogramming, (G, H) vmhc:mCherry-NTR; amhc:CreERT2; myl7:CSY and (I, J) vmhc:mCherry-NTR; amhc:CreERT2; myl7:CSY; hsp70l: dnMAML (dnM) hearts were exposed to tamoxifen at 5 dpf to genetically label atrial CMs with YFP (c-aYFP), then (G, I) sham-ablated (control) or (H, J) ventricle-ablated, and finally heat-shocked to (I, J) induce dnM expression. Confocal microscopy imaging at 72 hpt (8 dpf) reveals that (J) heat-shock induction of dnM inhibited the ability of genetically labeled c-aYFP+ atrial CMs to contribute to the regeneration of ventricle-ablated hearts when compared to (H) heat-shock control ventricle-ablated hearts. Yellow channel – (G’–J’) genetically labeled c-aYFP+ atrial CMs. (K) Quantitation of the percentage of ventricular area covered with c-aYFP+ CMs supports that dnMAML Notch inhibition prevents atrial CMs from regenerating the injured ventricle (n = 8 hsp70:dnM-, seven hsp70l:dnM+). All confocal images shown are maximum intensity projections. V, ventricle; A, atrium; dpf, days post-fertilization; hpt, hours post MTZ/DMSO treatment. Dashed lines outline the heart. Bar: 50 μm. (E, P) Mean + s.e.m. ANOVA; (K) Mean + s.d. Student’s t-test; (F, Q) Total numbers, Binomial test (versus 0 dpt); ns: p>0.05; *: p<0.05; **: p<0.01; ***: p<0.001; ****: p<0.0001. The following figure supplements are available for Figure 1. EXPRESSION / LABELING:
PHENOTYPE:
|
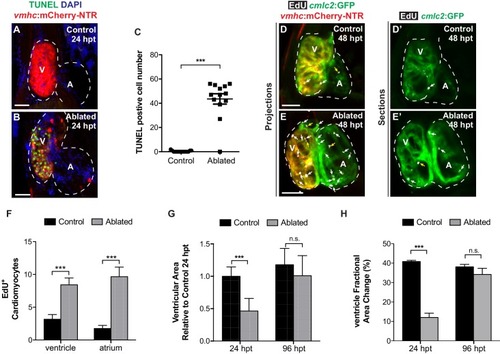
Following ventricular ablation, ventricular and atrial cardiomyocyte proliferation leads to cardiac recovery at 96 hpt. ( |
( |
Confocal microscopy imaging was performed on ( |
( |
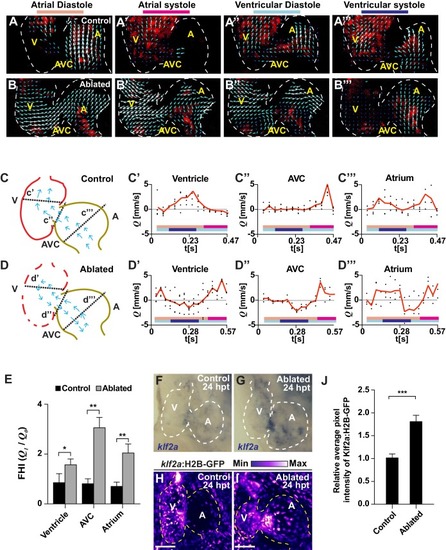
Ventricle-ablated hearts display altered oscillatory blood flow and Klf2a activation.( A, B) High-speed confocal imaging was performed on ( A) gata1:DsRed control hearts and ( B) vmhc:mCherry-NTR ; gata1:DsRed ventricle-ablated hearts at 24 hpt (six dpf). Arrows represent particle image velocimetry (PIV) generated vectors from blood flow at different stages of the heart cycle: ( A, B) atrial diastole, ( A’, B’) atrial systole, ( A’’, B’’) ventricular diastole, ( A’’’, B’’’) ventricular systole. ( C, D) Schematic representation indicates where flow rate ( Q) was calculated in ( C’– C’’’) control and ( D’– D’’’) ventricle-ablated hearts (dotted lines). Graphs show the calculated flow rate (mm/s) in the ( C’, D’) ventricle, ( C’’, D’’) atrio-ventricular canal (AVC) and ( C’’’, D’’’) atrium over time (t[s]). Black dots – flow rate ( Q) in each experimental replicate. Red lines – average blood flow rate ( Q). Experimental replicates = 5 control ventricle; 4 control AVC; 4 control atrium; 5 ablated ventricle; 3 ablated AVC; 3 ablated atrium. Colored horizontal bars on the bottom of each graph represent the cardiac cycle period: pink – atrial diastole; magenta – atrial systole; light blue – ventricular diastole; dark blue – ventricular systole. ( E) Fundamental harmonic index (FHI = Q1/ Q0) of the flow rate ( Q) in the ventricle, AVC and atrium of control and ventricle-ablated hearts at 24 hpt (6 dpf). n = 3 hearts each condition. ( F, G) Whole-mount in situ hybridizations show that klf2aexpression is increased in ( G) vmhc:mCherry-NTR ventricle-ablated hearts (n = 12/12) compared to ( F) control hearts at 24 hpt (n = 0/16) (6 dpf). ( H, I) Confocal imaging was performed on klf2a:H2B-GFP ; vmhc:mCherry-NTR ( H) control and ( I) ventricle-ablated hearts at 24 hpt (6 dpf) (n = 20 each condition). ( J) Quantitation of the relative average fluorescence intensity of klf2a:H2B-GFP in klf2a:H2B-GFP; vmhc:mCherry-NTR hearts at 24 hpt (6 dpf) confirms that klf2a:H2B-GFP is increased in ventricle-ablated hearts (n = 20 each condition). All confocal images shown are maximum intensity projections. V, ventricle; A, atrium; AVC, atrio-ventricular canal; dpf, days post-fertilization; hpt, hours post-MTZ/DMSO treatment. Dashed lines outline the heart. Bars: 50 μm. ( E, J) Mean + s.e.m. Student’s t-test, *, **, ***, p<0.05, p<0.01, p<0.001. The following figure supplements are available for Figure 2. |
( |
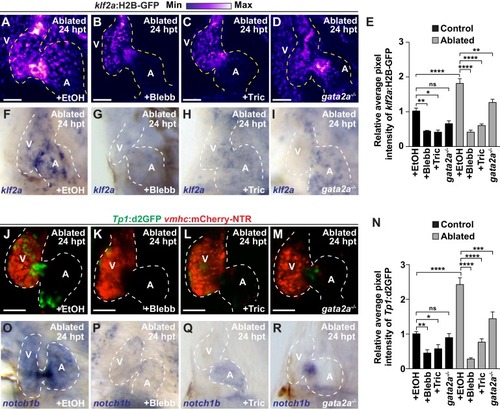
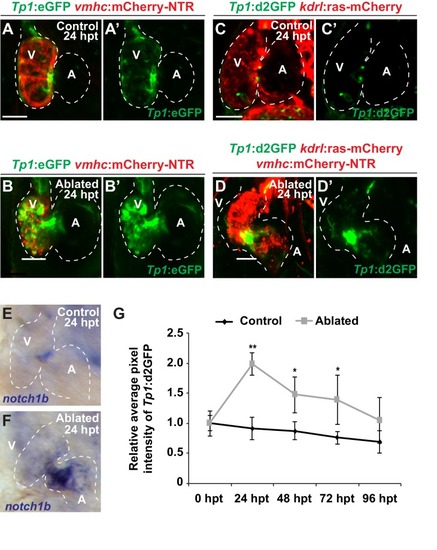
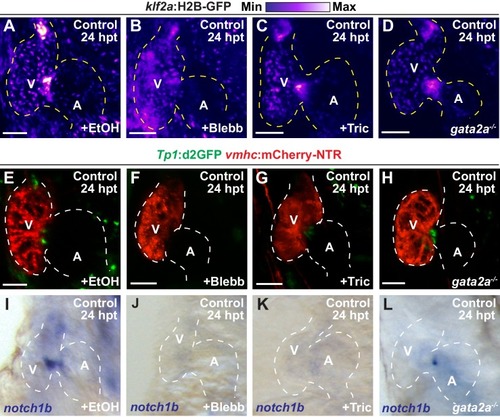
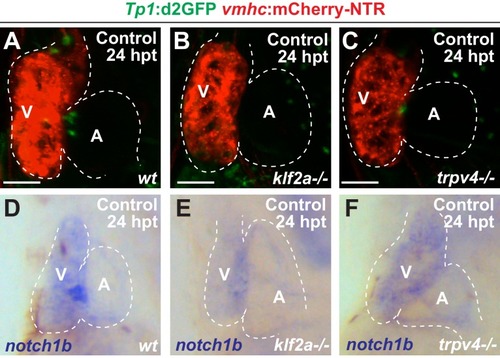
Reduced hemodynamic forces affect endocardial Notch and Klf2a post-injury activation.Confocal imaging performed on ( A–D) klf2a:H2B-GFP ; vmhc:mCherry-NTR or ( J–M) Tp1:d2GFP; vmhc:mCherry-NTR ventricle-ablated hearts at 24 hpt (6 dpf) reveals that ( D, M) gata2a-/- mutant hearts as well as wild-type hearts treated with ( B, K) blebbistatin (Blebb) or ( C, L) tricaine (Tric) exhibit reduced klf2a:H2B-GFP or Tp1:d2GFP expression when compared to ( A, J) ethanol (EtOH) sham-treated hearts. Quantitation of the relative average fluorescence intensity in control (black bars) and ventricle-ablated (gray bars) hearts confirms reduced ( E) klf2a:H2B-GFP or ( N) Tp1:d2GFP expression in gata2a-/- mutant hearts as well as wild-type hearts treated with blebbistatin or tricaine ( klf2a:H2B-GFP n = 12 control EtOh; 5 control Blebb; 7 control Tric; 9 control gata2a-/-; 11 MTZ EtOH; 6 MTZ Blebb; 6 MTZ Tric; 9 MTZ gata2a-/-. Tp1:d2GFP n = 12 control EtOh; 6 control Blebb; 7 control Tric; 9 control gata2a-/-; 11 MTZ EtOH; 6 MTZ Blebb; 6 MTZ Tric; 9 MTZ gata2a-/-). Whole-mount in situ hybridizations at 24 hpt (6 dpf) show that ( F–I) klf2a and ( O–R) notch1b expression is decreased in vmhc:mCherry-NTR ventricle-ablated hearts treated with ( G, P) blebbistatin (n = 0/8 klf2a; n = 2/12 notch1b) or ( H, Q) tricaine (n = 0/7 klf2a; n = 0/10 notch1b) as well as in ( I, R) gata2a-/- ventricle-ablated hearts (n = 3/9 klf2a; n = 5/12 notch1b) when compared to ( F, O) hearts sham-treated with ethanol (n = 7/7 klf2a; n = 10/10 notch1b). All confocal images shown are maximum intensity projections. V, ventricle; A, atrium; dpf, days post-fertilization; hpt, hours post-MTZ treatment. Dashed lines outline the heart. Bars: 50 μm. ( E, N) Mean + s.e.m. ANOVA, ns: p>0.05; *: p<0.05; **: p<0.01; ***: p<0.001; ****: p<0.0001. The following figure supplements are available for Figure 3. |
Inhibiting hemodynamic flow leads to reduced cardiac Klf2a and Notch signaling.( A–D) Confocal imaging performed on klf2a:H2B-GFP ; vmhc:mCherry-NTR uninjured hearts at 24 hpt (6 dpf) reveals decreased klf2a:H2B-GFP expression in ( B) blebbistatin (Blebb) and ( C) tricaine (Tric) treated hearts as well as in ( D) gata2a-/- mutant hearts when compared to ( A) ethanol (EtOH)-treated control hearts (n = 12 control EtOh; 6 control Blebb; 7 control Tric; 9 control gata2a-/-). ( E–H) Confocal imaging performed on Tp1:d2GFP ; vmhc:mCherry-NTR uninjured hearts at 24 hpt (6 dpf) shows decreased Tp1:d2GFP Notch reporter expression in hearts treated with ( F) blebbistatin or ( G) tricaine when compared to ( E) ethanol-treated control hearts; however, ( H) gata2a-/-hearts do not display significant changes as quantitatively assessed in Figure 3N(n = 12 control EtOh; 5 control Blebb; 7 control Tric; 9 control gata2a-/-). ( I–L) Whole-mount in situ hybridizations reveal decreased notch1b expression in hearts treated with ( J) blebbistatin (n = 0/9) or ( K) tricaine (n = 0/5) and in ( L) gata2a-/- hearts (n = 4/12) when compared to ( I) ethanol-treated control hearts (n = 10/10) at 24 hpt (6 dpf). All confocal images shown are maximum intensity projections. V, ventricle; A, atrium; dpf, days post-fertilization; hpt, hours post-DMSO treatment. Dashed lines outline the heart. Bars: 50 μm. |
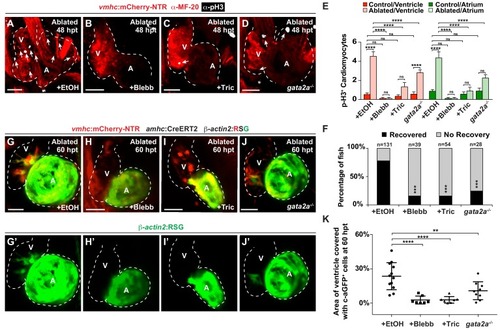
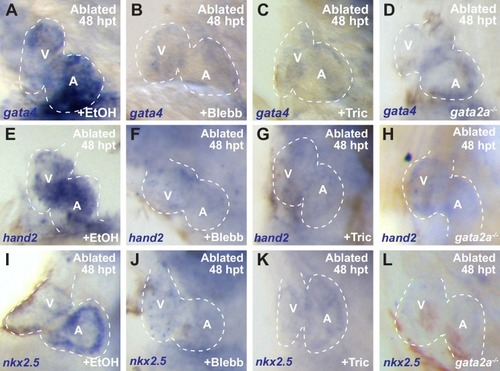
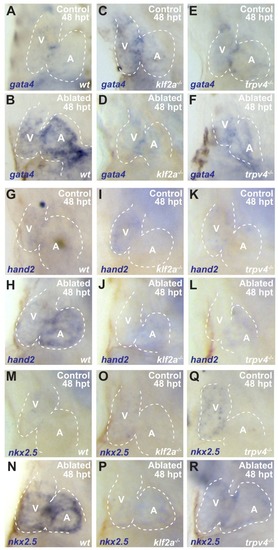
Hemodynamic forces control regeneration and myocardial reprogramming.( A–D) Confocal microscopy imaging performed on vmhc:mCherry-NTR ventricle-ablated hearts reveals that ( B) blebbistatin or ( C) tricaine treatment as well as ( D) the gata2a-/- mutant allele inhibit CM proliferation at 48 hpt (7 dpf) when compared to CM proliferation of ( A) ethanol-treated control hearts. White – anti-phospho-histone H3 immunostaining; red – anti-MF-20 immunostaining. Arrows point to proliferating CMs. ( E) Quantitation of anti-phospho-histone H3+ CMs in these hearts confirms that blebbistatin or tricaine treatment, and gata2a-/- defects block CM proliferation in injured hearts (n = 23, control EtOH; 21 MTZ EtOH; 9 control Blebb; 9 MTZ Blebb; 10 control Tric; 10 MTZ Tric; 9 control gata2a-/-; 16 MTZ gata2a-/-). Red bars – ventricle; green bars – atrium; dark bars – control sham-ablated hearts; light bars – ventricle-ablated hearts. ( F) Quantitation of the percentage of vmhc:mCherry-NTR ventricle-ablated hearts that display recovered ventricular tissue and contractility (black bars) at 96 hpt (9 dpf) shows that inhibiting contractility by blebbistatin or tricaine treatment as well as decreasing blood viscosity using gata2a-/- mutants impair heart regeneration. The number of fish analyzed for each condition is indicated above each column. ( G–J) Confocal microscopy imaging of vmhc:mCherry-NTR; amhc:CreERT2; β-actin2:RSG hearts at 60 hpt (7.5 dpf) reveals that ( H) blebbistatin-treated, ( I) tricaine-treated, or ( J) gata2a-/- ventricle-ablated hearts exhibit reduced ability of genetically labeled atrial CMs (c-aGFP+) to contribute to the regenerating injured ventricle when compared to ( G) ethanol sham-treated hearts. ( G’–J’) Green channel – genetically-labeled c-aGFP+ atrial CMs. ( K) Quantitation of the percentage of ventricular area covered with c-aGFP+ CMs confirms the reduced atrial CM contribution to the regenerating injured ventricle in gata2a-/- mutant hearts as well as wild-type hearts treated with blebbistatin or tricaine (n = 12 ethanol; 7 blebbistatin; 7 tricaine; 9 gata2a-/-). All confocal images shown are maximum intensity projections. V, ventricle; A, atrium; dpf, days post-fertilization; hpt, hours post-MTZ/DMSO treatment. Dashed lines outline the heart. Bars: 50 μm. ( E) Mean + s.e.m. ANOVA; ( K) Mean + s.d. ANOVA; ( F) Total numbers, Binomial test (versus EtOH); ns: p>0.05; *: p<0.05; **: p<0.01; ***: p<0.001; ****: p<0.0001. The following figure supplements are available for Figure 4. PHENOTYPE:
|
Whole-mount in situ hybridizations show increased ( |
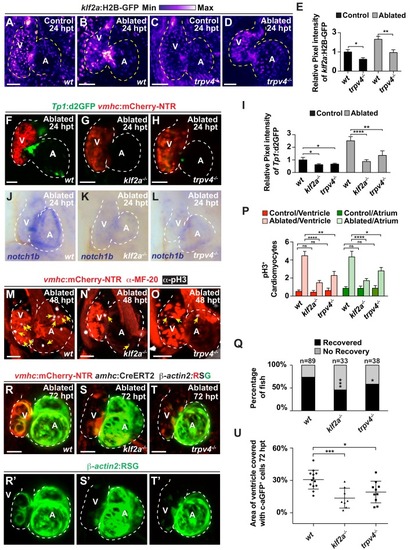
The mechanosensitive channel Trpv4 regulates endocardial Notch activation and myocardial regeneration through Klf2a.( A–D) Confocal imaging of vmhc:mCherry-NTR ; klf2a:H2B-GFP hearts shows that klf2a:H2B-GFP expression is activated in ( B) wild-type ( wt) ventricle-ablated hearts at 24 hpt (6 dpf) compared to ( A) control hearts; however, this activation is reduced in ( D) trpv4-/- ventricle-ablated hearts. ( F–H) Confocal imaging of vmhc:mCherry-NTR ; Tp1:d2GFP hearts further reveals that Tp1:d2GFP is decreased in ( G) klf2a-/- and ( H) trpv4-/- ventricle-ablated hearts at 24 hpt (6 dpf) when compared to ( F) wild-type ( wt) hearts. ( E, I) Quantitation of the relative average fluorescence intensity confirms reduced injury-induced ( E) klf2a:H2B-GFP activation in trpv4-/- ventricle-ablated hearts, and ( I) Tp1:d2GFP activation in trpv4-/- and klf2a-/- ventricle-ablated hearts when compared to wild-type ventricle-ablated hearts ( klf2a:H2B-GFP n = 9 control wt; 7 control trpv4-/-; 9 MTZ wt; 10 MTZ trpv4-/-. Tp1:d2GFP n = 15 control wt; 18 control trpv4-/-; 20 control klf2a-/-; 22 MTZ wt; 21 MTZ trpv4-/-; 18 MTZ klf2a-/). ( J–L) Whole-mount in situ hybridizations show that notch1b is decreased in ventricle-ablated ( K) klf2a-/- (n = 2/11) and ( L) trpv4-/- hearts (n = 6/15) at 24 hpt (6 dpf) when compared to ( J) wild-type hearts (n = 16/18). ( M–O) Confocal microscopy performed on vmhc:mCherry-NTR ventricle-ablated hearts reveals that ( N) klf2a-/- and ( O) trpv4-/-ventricle-ablated hearts display reduced CM proliferative response when compared to ( M) wild-type ( wt) ventricle-ablated hearts at 48 hpt (7 dpf). White – anti-phospho-histone H3 immunostaining; red – anti-MF-20 immunostaining. Arrows point to proliferating CMs. ( P) Quantitation of anti-phospho-histone H3+ CMs in these hearts confirms that klf2a-/- and trpv4-/- hearts fail to increase CM proliferation after ventricle-injury (n = 15 each condition). Red bars – ventricle; green bars – atrium; dark bars – control sham-ablated hearts; light bars – ventricle-ablated hearts. ( Q) Quantitation of the percentage of vmhc:mCherry-NTR ventricle-ablated hearts that display recovered ventricular tissue and contractility (black bars) at 96 hpt (9 dpf) supports that klf2a-/- and trpv4-/- mutants exhibit impaired heart regeneration. The number of fish analyzed for each condition is indicated above each column. ( R–T) Confocal microscopy imaging of vmhc:mCherry-NTR; amhc:CreERT2; β-actin2:RSGhearts at 72 hpt (8 dpf) shows that ( S) klf2a-/-and ( T) trpv4-/- ventricle-ablated hearts exhibit reduced contribution of genetically labeled atrial CMs (c-aGFP+) to the regenerating injured ventricle when compared to ( R) wild-type ventricle-ablated hearts. Green channel – ( R’–T’) genetically labeled c-aGFP+ atrial CMs. ( U) Quantitation of the percentage of ventricular area covered with c-aGFP+ CMs confirms that klf2a-/-or trpv4-/- hearts display reduced capacity to undergo injury-induced atrial-to-ventricular trans-differentiation during injury and regeneration (n = 13 wt; 8 klf2a-/-; 10 trpv4-/-). All confocal images shown are maximum intensity projections. V, ventricle; A, atrium; dpf, days post-fertilization; hpt, hours post-MTZ/DMSO treatment. Dashed lines outline the heart. Bars: 50 μm. ( E, I, P) Mean + s.e.m. ANOVA; ( Q) Total numbers, Binomial test (versus wild-type); ( U) Mean + s.d. ANOVA; ns: p>0.05; *: p<0.05; **: p<0.01; ***: p<0.001; ****: p<0.0001. The following figure supplements are available for Figure 5. |
( |
( |
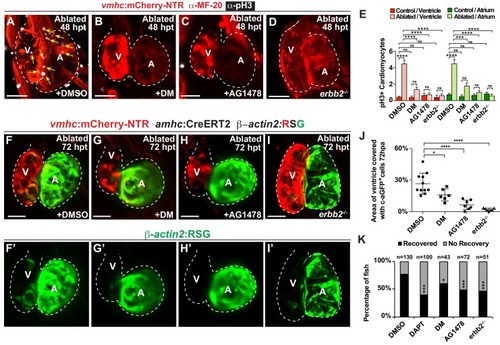
Erbb2 and BMP signaling regulate cardiac regeneration and atrial-to-ventricular trans-differentiation.( A–D) Confocal microscopy performed on vmhc:mCherry-NTR ventricle-ablated hearts reveals that ( B) dorsomorphin (DM) and ( C) AG1478-treated as well as ( D) erbb2 loss-of-function mutation ( erbb2-/-) ventricle-ablated hearts exhibit reduced CM proliferative response when compared to ( A) DMSO-treated ventricle-ablated hearts (control) at 48 hpt (7 dpf). White – anti-phospho-histone H3 immunostaining; red – anti-MF-20 immunostaining. Arrows point to proliferating CMs. ( E) Quantitation of anti-phospho-histone H3+ CMs in these hearts confirms that dorsomorphin and AG1478 treatments as well as loss of erbb2 function ( erbb2-/-) prevent CMs from proliferating in injured hearts (n = 15 each condition). Red bars – ventricle; green bars – atrium; dark bars – control sham-ablated hearts; light bars – ventricle-ablated hearts. ( F–I) Confocal imaging of vmhc:mCherry-NTR; amhc:CreERT2; β-actin2:RSGventricle-ablated hearts shows that ( G) dorsomorphin (DM) or ( H) AG1478 treatment as well as ( I) erbb2-/- blocks the contribution of genetically-labeled atrial CMs (c-aGFP+) to the regenerating ventricle-ablated hearts when compared to ( F) ventricle-ablated DMSO-treated control hearts at 72 hpt (8 dpf). Green channel – ( F’–I’) genetically labeled c-aGFP+ atrial CMs. ( J) Quantitation of the percentage of ventricular area covered with c-aGFP+ atrial CMs confirms that dorsomorphin or AG1478 treatments as well as loss of erbb2 function ( erbb2-/-) prevent atrial CMs from regenerating the injured ventricle (n = 11 DMSO; 6 dorsomorphin; 7 AG1478; 7 erbb2-/-). ( K) Quantitation of the percentage of vmhc:mCherry-NTR ventricle-ablated hearts that display recovered ventricular tissue and contractility (black bars) at 96 hpt (9 dpf) confirms that inhibiting BMP signaling with dorsomorphin or Erbb2 signaling with AG1478 impairs heart regeneration. The number of fish analyzed for each condition is indicated above each column. All confocal images shown are maximum intensity projections. V, ventricle; A, atrium; dpf, days post-fertilization; hpt, hours post-MTZ/DMSO treatment. Dashed lines outline the heart. Bars: 50 μm. ( E) Mean + s.e.m. ANOVA; ( J) Mean + s.d. ANOVA; ( K) Total numbers, Binomial test (versus DMSO); ns: p>0.05; *: p<0.05; **: p<0.01; ***: p<0.001; ****: p<0.0001. The following figure supplements are available for Figure 6. PHENOTYPE:
|
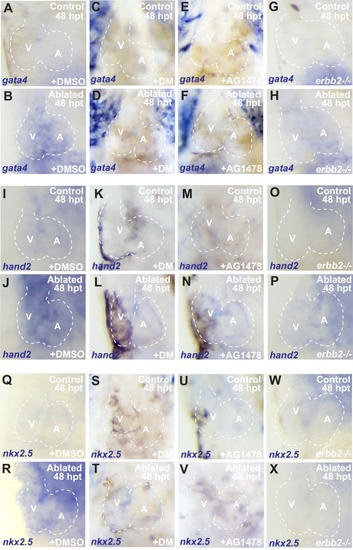
Whole-mount in situ hybridizations show increased ( |

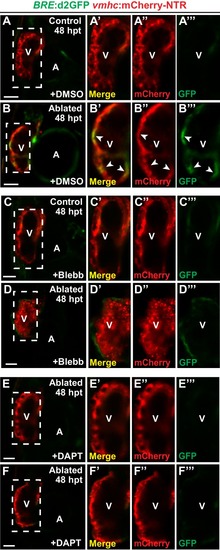
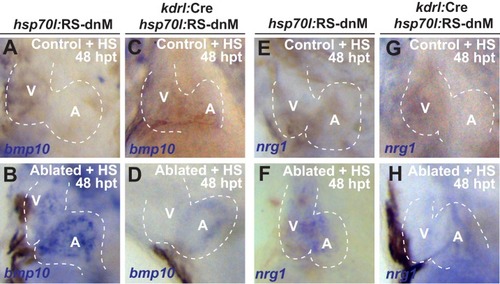
Blood flow regulates myocardial Erbb2 and BMP signaling through endocardial Notch. (A–F) Confocal imaging of BRE:d2GFP; vmhc:mCherry-NTR hearts at 48 hpt (7 dpf) shows that (B) BRE:d2GFP is activated after ventricular ablation (n = 21/21) when compared to (A) uninjured control hearts (n = 0/29); however, (D) blebbistatin (Blebb) (n = 0/11) or (F) DAPT (n = 0/14) treatment inhibits this BRE:d2GFP injury-induced activation. (G–R) Whole-mount in situ hybridizations reveal that bmp10 and nrg1 expression are increased in vmhc:mCherry–NTR (H, N) ventricle-ablated hearts (n = 13/14 bmp10; 7/8 nrg1) at 48 hpt (7 dpf) when compared to (G, M) control uninjured hearts (n = 0/18 bmp10; 0/13 nrg1), while treatment with (J, P) blebbistatin (n = 2/13 bmp10; 0/6 nrg1) or (L, R) DAPT (n = 4/16 bmp10; 0/7 nrg1) inhibits the injury-induced activation of bmp10 and nrg1. All confocal images shown are maximum intensity projections. V, ventricle; A, atrium; dpf, days post fertilization; hpt hours post-MTZ/DMSO treatment. Dashed lines outline the heart. Bars: 50 μm. The following figure supplements are available for Figure 7. |
( |
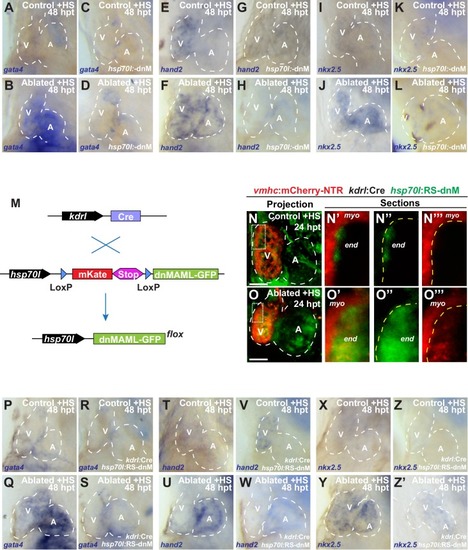
Whole-mount in situ hybridizations of heat-shocked (HS) ( |