Image
Figure Caption

Figure 1—figure supplement 1. Metronidazole-ablated <italic>vmhc:</italic>mCherry-NTR ventricles display initial cardiomyocyte death, loss of ventricular tissue and impairment of contractile function but later exhibit cardiomyocyte proliferation and recovery of ventricular tissue and contractile function.

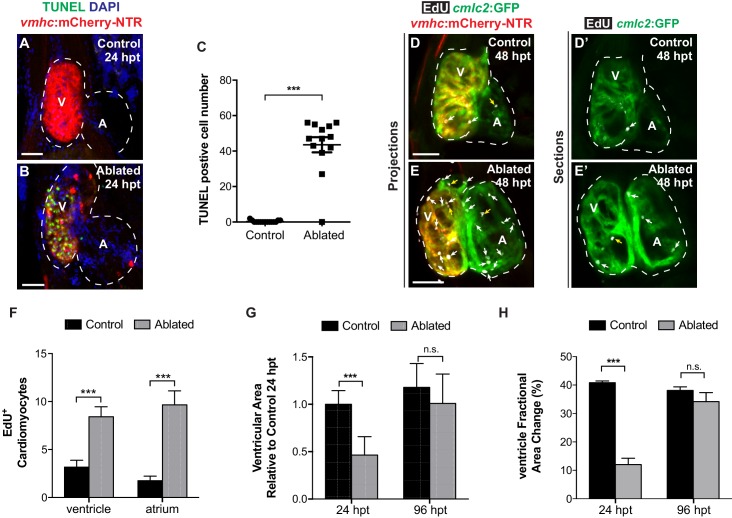
Following ventricular ablation, ventricular and atrial cardiomyocyte proliferation leads to cardiac recovery at 96 hpt. (A, B) Confocal maximum intensity projections of Tg(vmhc:mCherry-NTR) fish show extensive cell death as detected by TUNEL staining in the ventricles of (B) MTZ-treated fish when compared with (A) DMSO-treated controls at 24 hpt. (C) Quantitation of TUNEL-positive CMs in the ventricle of control (n = 15) and ablated (n = 13) fish hearts at 24 hpt confirms cell death is induced by MTZ treatment. (D, E) Confocal maximum intensity projections of Tg(cmlc2:GFP; vmhc:mCherry-NTR) fish show increased proliferation of CMs as detected by EdU+/cmlc2:GFP+ double positive staining (white arrows) in the ventricles and atria of (E) MTZ-treated fish when compared with (D) DMSO-treated controls at 48 hpt. Yellow arrows point to EdU+ proliferating non-cardiomyocytes. (D’, E’) Single confocal sections show EdU+ proliferating cells. (F) Quantitation of EdU+/cmlc2:GFP+ double positive CMs in the ventricle or atrium of control (n = 12) and ablated (n = 12) fish hearts at 48 hpt confirms increased proliferation in ventricle-ablated hearts. (G) Quantitation of ventricular area shows loss of myocardial ventricular tissue in Tg(vmhc:mCherry-NTR) MTZ-treated fish at 24 hpt (n = 12) when compared to control non-ablated fish (n = 7). At 96 hpt, Tg(vmhc:mCherry-NTR) MTZ-ablated hearts show recovery of ventricular area (n = 8, control; n = 9, ablated). (H) Quantitation of ventricular fractional area change (FAC) reveals decreased ventricular function in Tg(vmhc:mCherry-NTR) MTZ-treated fish at 24 hpt (n = 9) when compared to control non-ablated fish (n = 6). At 96 hpt, Tg(vmhc:mCherry-NTR) MTZ-ablated hearts (n = 5) dispaly comparable ventricular function to that of control hearts (n = 6). V, ventricle; A, atrium; dpf, days post-fertilization. Dashed lines outline the heart. Bars: 50 μm. (C) Mean + s.d. (F–H) Mean + s.e.m. Student’s t-test, ***, p<0.001; ns, p>0.05.

Acknowledgments
This image is the copyrighted work of the attributed author or publisher, and ZFIN has permission only to display this image to its users. Additional permissions should be obtained from the applicable author or publisher of the image. Full text @ Elife