
Figure 6
- ID
- ZDB-FIG-190723-1032
- Publication
- Gálvez-Santisteban et al., 2019 - Hemodynamic-mediated endocardial signaling controls in vivo myocardial reprogramming
- Other Figures
-
- figure 1
- Figure 1—figure supplement 1.
- Figure 1—figure supplement 2.
- Figure 1—figure supplement 3.
- Figure 1—figure supplement 4.
- Figure 2
- Figure 2—figure supplement 2.
- Figure 3
- Figure 3—figure supplement 1.
- Figure 4
- Figure 4—figure supplement 1.
- Figure 5
- Figure 5—figure supplement 1.
- Figure 5—figure supplement 2.
- Figure 6
- Figure 6—figure supplement 1.
- Figure 7
- Figure 7—figure supplement 1.
- Figure 7—figure supplement 2.
- All Figure Page
- Back to All Figure Page
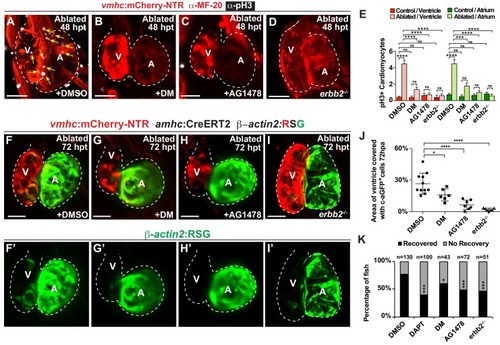
Erbb2 and BMP signaling regulate cardiac regeneration and atrial-to-ventricular trans-differentiation.( A–D) Confocal microscopy performed on vmhc:mCherry-NTR ventricle-ablated hearts reveals that ( B) dorsomorphin (DM) and ( C) AG1478-treated as well as ( D) erbb2 loss-of-function mutation ( erbb2-/-) ventricle-ablated hearts exhibit reduced CM proliferative response when compared to ( A) DMSO-treated ventricle-ablated hearts (control) at 48 hpt (7 dpf). White – anti-phospho-histone H3 immunostaining; red – anti-MF-20 immunostaining. Arrows point to proliferating CMs. ( E) Quantitation of anti-phospho-histone H3+ CMs in these hearts confirms that dorsomorphin and AG1478 treatments as well as loss of erbb2 function ( erbb2-/-) prevent CMs from proliferating in injured hearts (n = 15 each condition). Red bars – ventricle; green bars – atrium; dark bars – control sham-ablated hearts; light bars – ventricle-ablated hearts. ( F–I) Confocal imaging of vmhc:mCherry-NTR; amhc:CreERT2; β-actin2:RSGventricle-ablated hearts shows that ( G) dorsomorphin (DM) or ( H) AG1478 treatment as well as ( I) erbb2-/- blocks the contribution of genetically-labeled atrial CMs (c-aGFP+) to the regenerating ventricle-ablated hearts when compared to ( F) ventricle-ablated DMSO-treated control hearts at 72 hpt (8 dpf). Green channel – ( F’–I’) genetically labeled c-aGFP+ atrial CMs. ( J) Quantitation of the percentage of ventricular area covered with c-aGFP+ atrial CMs confirms that dorsomorphin or AG1478 treatments as well as loss of erbb2 function ( erbb2-/-) prevent atrial CMs from regenerating the injured ventricle (n = 11 DMSO; 6 dorsomorphin; 7 AG1478; 7 erbb2-/-). ( K) Quantitation of the percentage of vmhc:mCherry-NTR ventricle-ablated hearts that display recovered ventricular tissue and contractility (black bars) at 96 hpt (9 dpf) confirms that inhibiting BMP signaling with dorsomorphin or Erbb2 signaling with AG1478 impairs heart regeneration. The number of fish analyzed for each condition is indicated above each column. All confocal images shown are maximum intensity projections. V, ventricle; A, atrium; dpf, days post-fertilization; hpt, hours post-MTZ/DMSO treatment. Dashed lines outline the heart. Bars: 50 μm. ( E) Mean + s.e.m. ANOVA; ( J) Mean + s.d. ANOVA; ( K) Total numbers, Binomial test (versus DMSO); ns: p>0.05; *: p<0.05; **: p<0.01; ***: p<0.001; ****: p<0.0001. The following figure supplements are available for Figure 6. |
| Fish: | |
|---|---|
| Conditions: | |
| Observed In: | |
| Stage: | Days 7-13 |