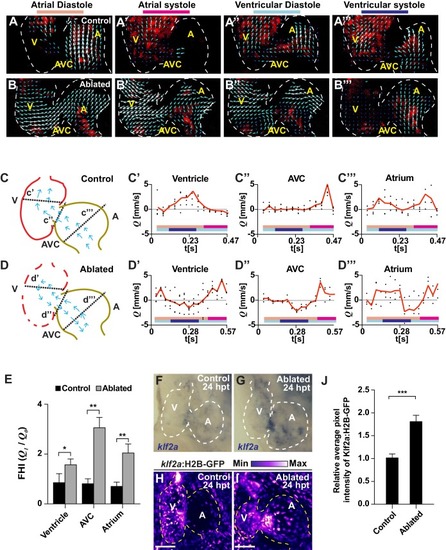
( A, B) High-speed confocal imaging was performed on ( A) gata1:DsRed control hearts and ( B) vmhc:mCherry-NTR ; gata1:DsRed ventricle-ablated hearts at 24 hpt (six dpf). Arrows represent particle image velocimetry (PIV) generated vectors from blood flow at different stages of the heart cycle: ( A, B) atrial diastole, ( A’, B’) atrial systole, ( A’’, B’’) ventricular diastole, ( A’’’, B’’’) ventricular systole. ( C, D) Schematic representation indicates where flow rate ( Q) was calculated in ( C’– C’’’) control and ( D’– D’’’) ventricle-ablated hearts (dotted lines). Graphs show the calculated flow rate (mm/s) in the ( C’, D’) ventricle, ( C’’, D’’) atrio-ventricular canal (AVC) and ( C’’’, D’’’) atrium over time (t[s]). Black dots – flow rate ( Q) in each experimental replicate. Red lines – average blood flow rate ( Q). Experimental replicates = 5 control ventricle; 4 control AVC; 4 control atrium; 5 ablated ventricle; 3 ablated AVC; 3 ablated atrium. Colored horizontal bars on the bottom of each graph represent the cardiac cycle period: pink – atrial diastole; magenta – atrial systole; light blue – ventricular diastole; dark blue – ventricular systole. ( E) Fundamental harmonic index (FHI = Q1/ Q0) of the flow rate ( Q) in the ventricle, AVC and atrium of control and ventricle-ablated hearts at 24 hpt (6 dpf). n = 3 hearts each condition. ( F, G) Whole-mount in situ hybridizations show that klf2aexpression is increased in ( G) vmhc:mCherry-NTR ventricle-ablated hearts (n = 12/12) compared to ( F) control hearts at 24 hpt (n = 0/16) (6 dpf). ( H, I) Confocal imaging was performed on klf2a:H2B-GFP ; vmhc:mCherry-NTR ( H) control and ( I) ventricle-ablated hearts at 24 hpt (6 dpf) (n = 20 each condition). ( J) Quantitation of the relative average fluorescence intensity of klf2a:H2B-GFP in klf2a:H2B-GFP; vmhc:mCherry-NTR hearts at 24 hpt (6 dpf) confirms that klf2a:H2B-GFP is increased in ventricle-ablated hearts (n = 20 each condition). All confocal images shown are maximum intensity projections. V, ventricle; A, atrium; AVC, atrio-ventricular canal; dpf, days post-fertilization; hpt, hours post-MTZ/DMSO treatment. Dashed lines outline the heart. Bars: 50 μm. ( E, J) Mean + s.e.m. Student’s t-test, *, **, ***, p<0.05, p<0.01, p<0.001. The following figure supplements are available for Figure 2.