|
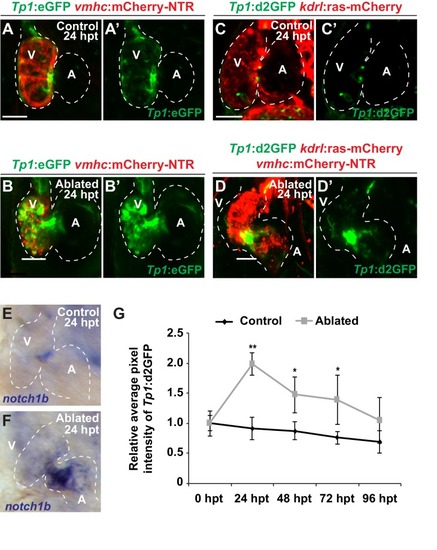
Endocardial Notch signaling is transiently activated after myocardial injury.Confocal microscopy imaging was performed on (A) Tp1:eGFP; vmhc:mCherry-NTR control or (B) ventricle-ablated hearts at 24 hr post-treatment/hpt (6 dpf). Green channel – (A’, B’) Tp1:eGFP. (C, D) Confocal microscopy imaging was performed on (C) Tp1:d2GFP; kdrl:ras-mCherry control or (D) Tp1:d2GFP; kdrl:ras-mCherry; vmhc:mCherry-NTR ventricle-ablated hearts at 24 hr post-treatment/hpt (6 dpf). Green channel – (C’, D’) Tp1:d2GFP. (E, F) Whole-mount in situ hybridizations show that notch1b expression is increased in (F) Tp1:d2GFP; vmhc:mCherry-NTR ventricle-ablated hearts (n = 16/18) at 24 hpt (6 dpf) compared to (E) control hearts (n = 0/20). (G) Quantitation of the average fluorescence intensity of the Tp1:d2GFP signal analyzed in control (black lines) or ventricle-ablated (gray lines) Tp1:d2GFP; vmhc:mCherry-NTR hearts shows that Tp1:d2GFP expression peaks at 24 hpt and gradually decreases as the ventricle regenerates (n = 10 control 0–96 hpt; 12 MTZ 0–96 hpt). All confocal images shown are maximum intensity projections. V, ventricle; A, atrium; dpf, days post-fertilization; hpt, hours post-MTZ/DMSO treatment; dpt, days post-MTZ treatment. Dashed lines outline the heart. Bars: 50 μm. Mean + s.e.m. Student’s t test,*, **, p<0.05 and p<0.01.
|