- Title
-
Cellular-Resolution Imaging of Vestibular Processing across the Larval Zebrafish Brain
- Authors
- Favre-Bulle, I.A., Vanwalleghem, G., Taylor, M.A., Rubinsztein-Dunlop, H., Scott, E.K.
- Source
- Full text @ Curr. Biol.
|
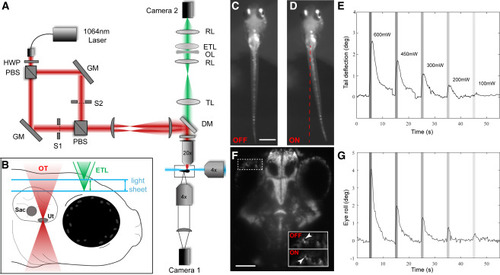
Combining SPIM Imaging and OT in Larval Zebrafish (A) A conceptual diagram of our OT SPIM microscope. A 1,064 nm laser beam passed through a half wave plate (HWP) and a polarizing beam splitter (PBS) that produced two beams of same intensity. The two beams were separately steered with gimbal-mounted mirrors (GM) before being recombined and projected onto the back focal plane of a 20× objective via two lenses and a short-pass dichroic mirror (DM). Camera 1 recorded tail movements via a 4× objective located below the larva. (B) A diagram of the approach for volumetric SPIM imaging during OT. Two 488-nm light sheets (one from the front and one from the side of the larva) were produced and scanned in the z axis using 2D galvo mirrors. Camera 2 imaged fluorescent emissions from GCaMP6s through a tube lens (TL), relay lenses (RLs), an electrically tunable lens (ETL), and an offset lens (OL). Coordinated control of the galvo mirrors and ETL allowed volumetric scanning of a 300-μm-deep volume of the brain. (C–E) Images from camera 1 of a larva without (C) and with (D) a 600-mW trap on the lateral side of the left otolith. Average tail deflections resulting from different OT powers are shown in (E). Powers are indicated and maintained through (G) and other subsequent figures. (F and G) An image from camera 2 (F) showing the eye position before (OFF) and during (ON) the same OT. Average eye movements are shown in (G). Scale bars represent 500 μm in (C) and 100 μm in (F). n = 6 for (E) and (G). A detailed description of the optical setup and its parts can be found in the STAR Methods section. See also Videos S1 and S2. |
|
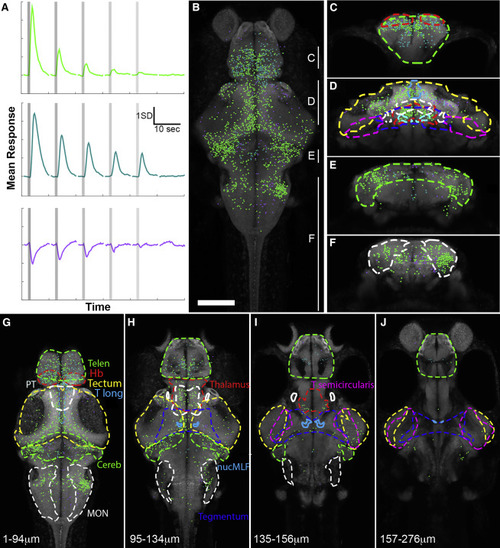
Vestibular Responses across the Larval Zebrafish Brain (A) Functional clustering of 4,611 vestibular-responsive ROIs revealed three distinct response profiles. This panel shows the mean response across each cluster of neurons to fictive vestibular stimuli at various OT powers (indicated in Figure 1), applied to the lateral edge of the right utricular otolith. Vertical lines show the times of stimulation, and three trials at each power are averaged to produce this graph. (B) A maximum intensity projection of all ROIs’ locations in a combined reference brain (a rotation of this stack is shown in Video S4). ROIs’ colors correspond to their cluster, as shown in (A), and are maintained throughout this paper. (C–F) Coronal virtual stacks at different rostro-caudal positions of the map (rostro-caudal ranges are indicated in B), with responsive brain regions delineated. (G–J) Virtual horizontal stacks at different dorso-ventral positions (indicated distances below the dorsal surface of the brain) with the same regions delineated. Regional outlines are color coded and labeled as follows: Telen, telencephalon; Hb, habenulae; PT, pretectum; T Long, torus longitudinalis; Cereb, cerebellum; MON, medial octavolateralis nucleus; nucMLF, nucleus of the medial longitudinal fascicle; T semicircularis, torus semicircularis. Scale bar in (B) indicates 100 μm. (B) and (G)–(J) are rostral up (as for all dorsal images in the paper), and (C)–(F) are dorsal up (as for all coronal images in the paper). This figure shows the combined results across 13 whole larval brains in response to outward trapping of the right otolith, and the same applies to Figures 3, 4, and 5. See also Figures S1, S2, S3, and S4, Videos S3 and S4, and Table S2. |
|
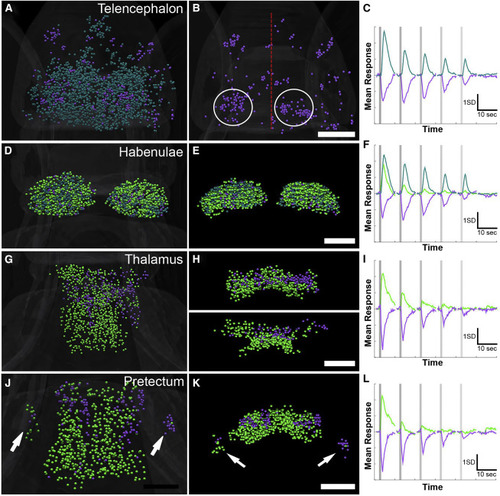
Vestibular Responses in the Forebrain (A–C) Telencephalic responses (dorsal view, A) include excited and inhibited (shown alone in B) ROIs (average traces for these two clusters are shown in C). Several regional concentrations of inhibited ROIs are spread throughout the telencephalon, with a tendency toward medial regions of the ipsilateral (right) and lateral regions of the contralateral (left) side (circles in B, with the midline indicated by a red line). (D–F) Dorsal (D) and coronal (E) views of the habenulae show even distribution of three clusters (F). (G–I) Two clusters in the thalamus are shown in dorsal (G) and coronal (H) views, with the dorsal (H, top) and ventral (H, bottom) segmented separately. These clusters’ traces are shown in (I). (J–L) The pretectum (dorsal in J and coronal in K) contains ROIs with two similar clusters (L). The laterality of responses is notable in the migrated pretectal region M1 (arrows, J and K). Scale bars indicate 50 μm, and magnification is the same across each row. See also Figures S1 and S4 and Tables S1 and S2. |
|
Midbrain Responses to Vestibular Stimuli (A–D) Dorsal views of the tectal PVL (A) and neuropil (B), with coronal views (neuropil, top; PVL, bottom) shown in (C). The average responses of these clusters are shown in (D). (E and F) The tegmentum (dorsal view in E and average response in F) has a single cluster, predominantly contralateral to the right (stimulated) ear. (G and H) The nMLF contains two clusters (mapped in G, with average responses in H), with a majority of responsive neurons contralateral to the stimulation. Sparse inhibited ROIs are located ipsilaterally. Red lines in (E) and (G) indicate the midline, and scale bars indicate 50 μm. See also Figures S1 and S4 and Tables S1 and S2. |
|
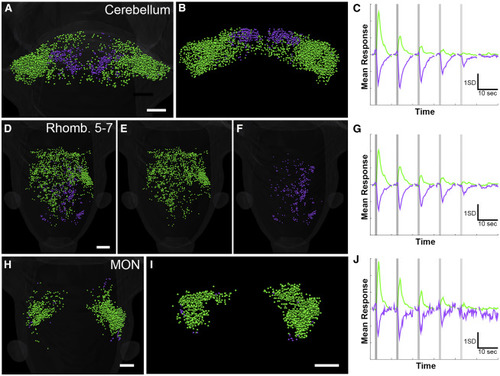
Hindbrain Responses in the Cerebellum, MON, and Rhombomeres 5–7 (A–C) Dorsal (A) and coronal (B) views of the cerebellum, showing two clusters (C) with sharp topographical distributions. (D–G) Excited (D and E) and inhibited (D and F) ROIs in rhombomeres 5–7. Excited ROIs are located roughly evenly across the midline, while inhibited ROIs are dominantly ipsilateral to the stimulated (right) otolith. Average responses of the clusters present in this region are shown in (G). (H–J) Dorsal (H) and coronal (I) views of the MON (clusters shown in J), where excited ROIs are bilateral but more numerous ipsilateral to the stimulus, and a small number of inhibited neurons are scattered around the periphery. Scale bars indicate 50 μm. The scale bar in (A) applies to (B), and the scale bar in (D) applies to (E) and (F). See also Figures S1 and S4 and Tables S1 and S2. |
|
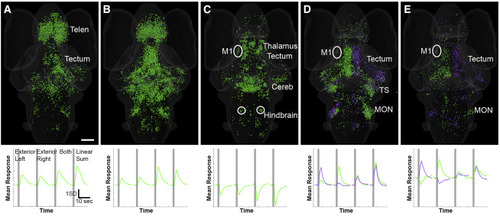
Responses to Bilateral Fictive Vestibular Stimulation (A–C) Three functional clusters of ROIs are shown (top), each with a characteristic response profile to an optical trap on the exterior of the left otolith, the right otolith, both traps simultaneously, or the computed linear sum (bottom). The two excited clusters (one summing bilateral stimuli slightly sublinearly shown in A and one summing bilateral stimuli slightly superlinearly in B) show essentially bilaterally symmetrical responses to the traps. A bilaterally inhibited cluster is shown in (C). (D and E) Two pairs of asymmetrical clusters, which respond with mirror image patterns to each other, are shown. The clusters in (D) show essentially unilateral responses, while those in (E) are excited by traps on one side and inhibited by traps on the other. Regions with notable concentrations of functional clusters are indicated, as described in the text. 3D rotations of (A)–(E) are shown in Videos S5 and S6. Scale bar indicates 100 μm and applies to all panels. Telen, telencephalon; M1, migrated pretectal region M1; Cereb, cerebellum; TS, torus semicircularis, MON, medial octavolateral nucleus. See also Figures S1 and S4, Videos S5 and S6, and Table S1. |
|
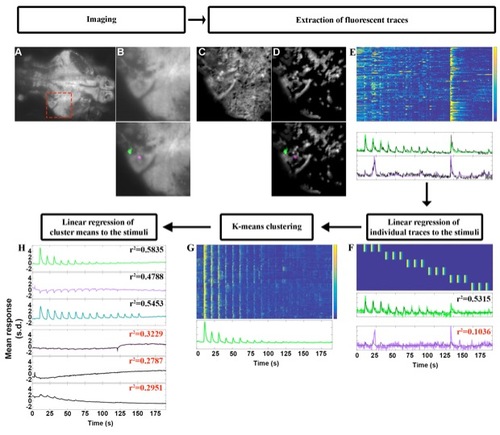
Flowchart of the Data analysis, related to Figure 2 A. Example plane, averaged across time, from our volumetric imaging, during optical trapping stimulation. B. Close up from the red square in A, below is the overlay of two ROIs from the CNMF analysis. C. Spatial footprints of all the ROIs obtained from CNMF before D. and after rejecting components deemed unfit by CNMF, below are the same two ROIs as in B. E. Top, raster plot of the z-scored traces extracted from the 140 ROIs in D. Bottom, traces of the two ROIs highlighted in B and D (bottom). The z-scored denoised traces from CNMF are plotted in color corresponding to the color of the highlighted ROIs in B and D, and in black are the z-scored raw fluorescence traces. F. Top, raster plot of the regressors used in the linear regression. Bottom, plot of the z-scored traces (color) and the fitted linear model (black), with the r-squared value of that fit, red indicates that the r2 value is below the 0.15 threshold. G. Top, raster plot of the cluster to which the green trace from F belongs. Bottom, mean response of the cells in this cluster. H. The top three plots correspond to the three clusters from Figure 2, selected by linear regression using the regressors shown in F. Below are three clusters that were discarded because their r-squared values were below our threshold of 0.4. |
|
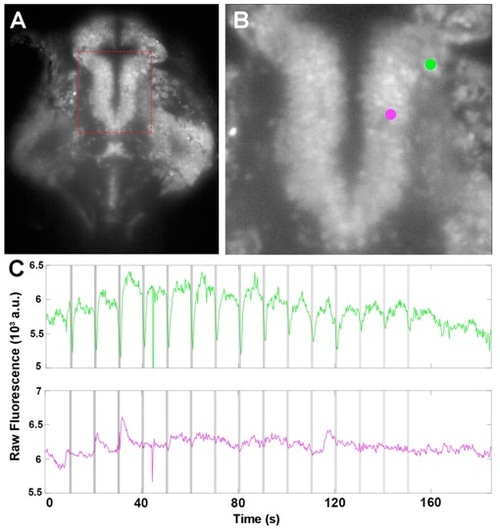
Inhibitory traces in the Thalamus, related to Figure 2 A. Time averaged plane from our volumetric imaging, showing the Thalamus (red square). B. Close up from A. Two adjacent ROIs are highlighted in green and magenta. C. The green ROI shows inhibition during the OT (grey vertical lines, shade indicate the power), whereas the adjacent ROI (magenta) shows some spontaneous activity, but no consistent response to the traps. See Video S4. |
|
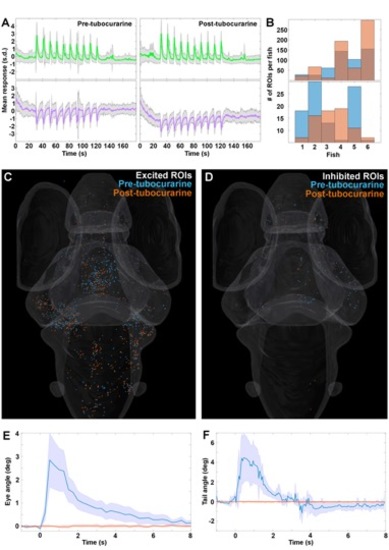
Paralysis of fish does not affect neuronal responses, related to Figure 2 to 6 Plots of the average z-scored neural responses before (left) and after (right) treatment with tubocurarine (s.d. = shaded area, n=6 fish) for the excitatory (green) and inhibitory (magenta) clusters identified previously. Ten repetitions of a 450mW OT were used as stimuli. B. Histogram of the number of ROIs in each individual fish for the excitatory (top) and inhibitory (bottom) clusters, before (blue) and after (orange) tubocurarine treatment. C. Distribution of the responses from the excited (green) cluster in A, colored by treatment state as in B. D. Distribution of the responses from the inhibited (purple) cluster in A, colored by treatment state as in B. E. Eye movement amplitude before (blue) and after (orange) tubocurarine treatment. F. Tail movement amplitude before (blue) and after (orange) tubocurarine treatment. Shaded area indicates s.d., and n=5 for behavioral data in E and 4 in F. |

