
|
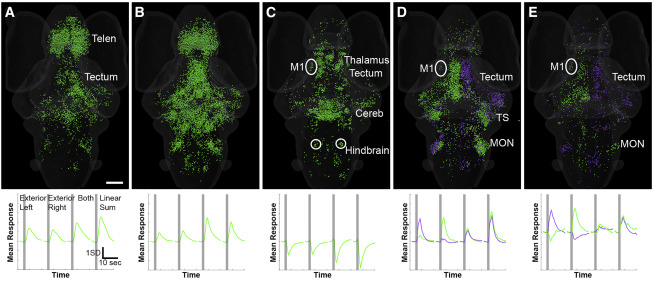
Fig. 6 Responses to Bilateral Fictive Vestibular Stimulation
(A–C) Three functional clusters of ROIs are shown (top), each with a characteristic response profile to an optical trap on the exterior of the left otolith, the right otolith, both traps simultaneously, or the computed linear sum (bottom). The two excited clusters (one summing bilateral stimuli slightly sublinearly shown in A and one summing bilateral stimuli slightly superlinearly in B) show essentially bilaterally symmetrical responses to the traps. A bilaterally inhibited cluster is shown in (C).
(D and E) Two pairs of asymmetrical clusters, which respond with mirror image patterns to each other, are shown. The clusters in (D) show essentially unilateral responses, while those in (E) are excited by traps on one side and inhibited by traps on the other. Regions with notable concentrations of functional clusters are indicated, as described in the text.
3D rotations of (A)–(E) are shown in Videos S5 and S6. Scale bar indicates 100 μm and applies to all panels. Telen, telencephalon; M1, migrated pretectal region M1; Cereb, cerebellum; TS, torus semicircularis, MON, medial octavolateral nucleus. See also Figures S1 and S4, Videos S5 and S6, and Table S1.