
|
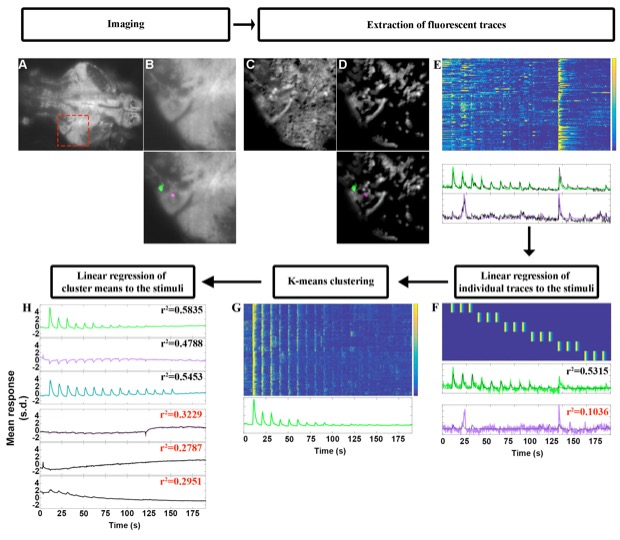
Fig. S2 Flowchart of the Data analysis, related to Figure 2
A. Example plane, averaged across time, from our volumetric imaging, during optical trapping stimulation. B. Close up from the red square in A, below is the overlay of two ROIs from the CNMF analysis. C. Spatial footprints of all the ROIs obtained from CNMF before D. and after rejecting components deemed unfit by CNMF, below are the same two ROIs as in B. E. Top, raster plot of the z-scored traces extracted from the 140 ROIs in D. Bottom, traces of the two ROIs highlighted in B and D (bottom). The z-scored denoised traces from CNMF are plotted in color corresponding to the color of the highlighted ROIs in B and D, and in black are the z-scored raw fluorescence traces. F. Top, raster plot of the regressors used in the linear regression. Bottom, plot of the z-scored traces (color) and the fitted linear model (black), with the r-squared value of that fit, red indicates that the r2 value is below the 0.15 threshold. G. Top, raster plot of the cluster to which the green trace from F belongs. Bottom, mean response of the cells in this cluster. H. The top three plots correspond to the three clusters from Figure 2, selected by linear regression using the regressors shown in F. Below are three clusters that were discarded because their r-squared values were below our threshold of 0.4.