
|
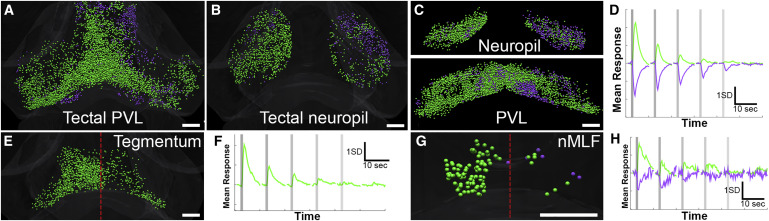
Fig. 4 Midbrain Responses to Vestibular Stimuli
(A–D) Dorsal views of the tectal PVL (A) and neuropil (B), with coronal views (neuropil, top; PVL, bottom) shown in (C). The average responses of these clusters are shown in (D).
(E and F) The tegmentum (dorsal view in E and average response in F) has a single cluster, predominantly contralateral to the right (stimulated) ear.
(G and H) The nMLF contains two clusters (mapped in G, with average responses in H), with a majority of responsive neurons contralateral to the stimulation. Sparse inhibited ROIs are located ipsilaterally.
Red lines in (E) and (G) indicate the midline, and scale bars indicate 50 μm. See also Figures S1 and S4 and Tables S1 and S2.