
FIGURE
Fig. S3
Fig. S3
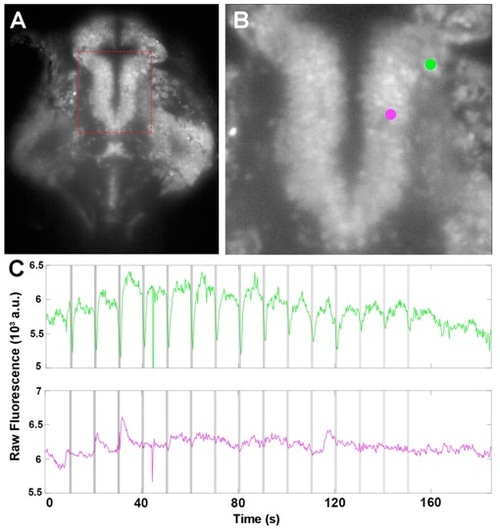
Inhibitory traces in the Thalamus, related to Figure 2 A. Time averaged plane from our volumetric imaging, showing the Thalamus (red square). B. Close up from A. Two adjacent ROIs are highlighted in green and magenta. C. The green ROI shows inhibition during the OT (grey vertical lines, shade indicate the power), whereas the adjacent ROI (magenta) shows some spontaneous activity, but no consistent response to the traps. See Video S4. |
Expression Data
Expression Detail
Antibody Labeling
Phenotype Data
Phenotype Detail
Acknowledgments
This image is the copyrighted work of the attributed author or publisher, and
ZFIN has permission only to display this image to its users.
Additional permissions should be obtained from the applicable author or publisher of the image.
Full text @ Curr. Biol.