
|
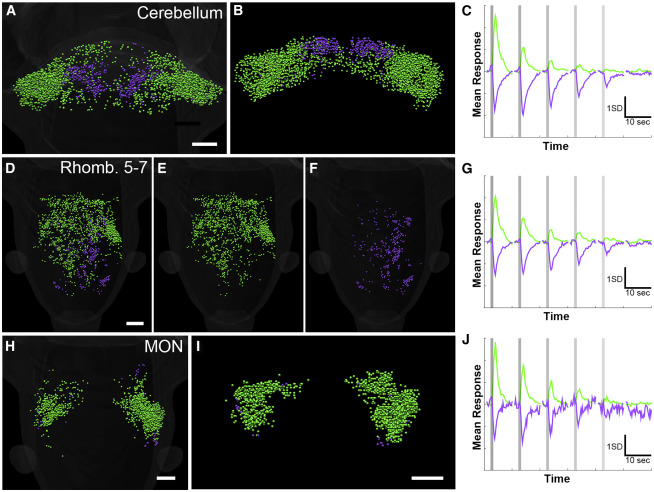
Fig. 5 Hindbrain Responses in the Cerebellum, MON, and Rhombomeres 5–7
(A–C) Dorsal (A) and coronal (B) views of the cerebellum, showing two clusters (C) with sharp topographical distributions.
(D–G) Excited (D and E) and inhibited (D and F) ROIs in rhombomeres 5–7. Excited ROIs are located roughly evenly across the midline, while inhibited ROIs are dominantly ipsilateral to the stimulated (right) otolith. Average responses of the clusters present in this region are shown in (G).
(H–J) Dorsal (H) and coronal (I) views of the MON (clusters shown in J), where excited ROIs are bilateral but more numerous ipsilateral to the stimulus, and a small number of inhibited neurons are scattered around the periphery.
Scale bars indicate 50 μm. The scale bar in (A) applies to (B), and the scale bar in (D) applies to (E) and (F). See also Figures S1 and S4 and Tables S1 and S2.