
|
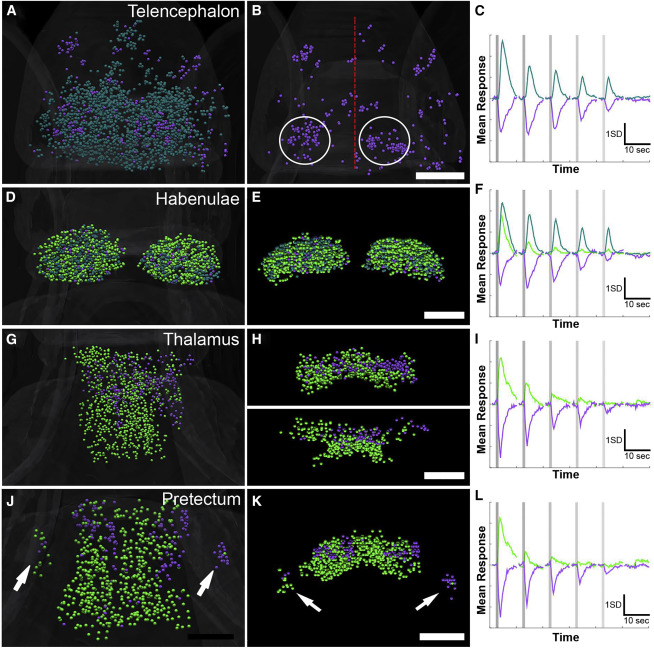
Fig. 3 Vestibular Responses in the Forebrain
(A–C) Telencephalic responses (dorsal view, A) include excited and inhibited (shown alone in B) ROIs (average traces for these two clusters are shown in C). Several regional concentrations of inhibited ROIs are spread throughout the telencephalon, with a tendency toward medial regions of the ipsilateral (right) and lateral regions of the contralateral (left) side (circles in B, with the midline indicated by a red line).
(D–F) Dorsal (D) and coronal (E) views of the habenulae show even distribution of three clusters (F).
(G–I) Two clusters in the thalamus are shown in dorsal (G) and coronal (H) views, with the dorsal (H, top) and ventral (H, bottom) segmented separately. These clusters’ traces are shown in (I).
(J–L) The pretectum (dorsal in J and coronal in K) contains ROIs with two similar clusters (L). The laterality of responses is notable in the migrated pretectal region M1 (arrows, J and K).
Scale bars indicate 50 μm, and magnification is the same across each row. See also Figures S1 and S4 and Tables S1 and S2.