
|
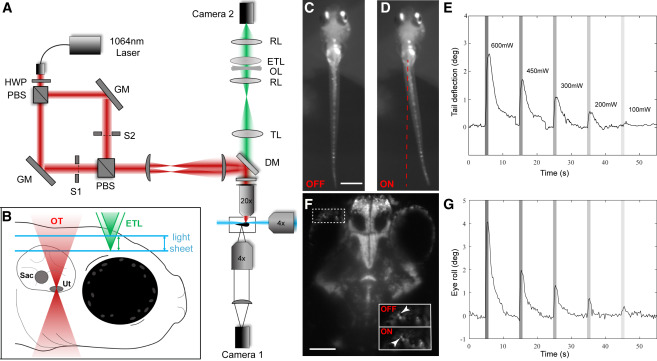
Fig. 1 Combining SPIM Imaging and OT in Larval Zebrafish
(A) A conceptual diagram of our OT SPIM microscope. A 1,064 nm laser beam passed through a half wave plate (HWP) and a polarizing beam splitter (PBS) that produced two beams of same intensity. The two beams were separately steered with gimbal-mounted mirrors (GM) before being recombined and projected onto the back focal plane of a 20× objective via two lenses and a short-pass dichroic mirror (DM). Camera 1 recorded tail movements via a 4× objective located below the larva.
(B) A diagram of the approach for volumetric SPIM imaging during OT. Two 488-nm light sheets (one from the front and one from the side of the larva) were produced and scanned in the z axis using 2D galvo mirrors. Camera 2 imaged fluorescent emissions from GCaMP6s through a tube lens (TL), relay lenses (RLs), an electrically tunable lens (ETL), and an offset lens (OL). Coordinated control of the galvo mirrors and ETL allowed volumetric scanning of a 300-μm-deep volume of the brain.
(C–E) Images from camera 1 of a larva without (C) and with (D) a 600-mW trap on the lateral side of the left otolith. Average tail deflections resulting from different OT powers are shown in (E). Powers are indicated and maintained through (G) and other subsequent figures.
(F and G) An image from camera 2 (F) showing the eye position before (OFF) and during (ON) the same OT. Average eye movements are shown in (G).
Scale bars represent 500 μm in (C) and 100 μm in (F). n = 6 for (E) and (G). A detailed description of the optical setup and its parts can be found in the STAR Methods section. See also Videos S1 and S2.