
|
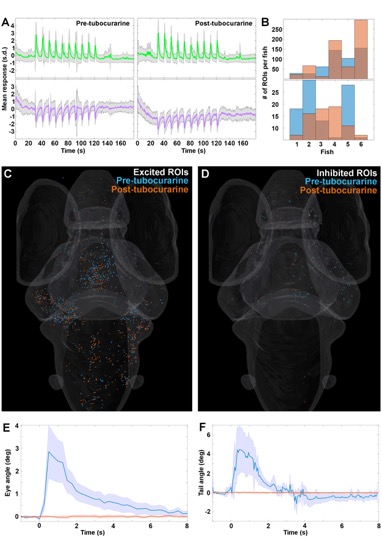
Fig. S4 Paralysis of fish does not affect neuronal responses, related to Figure 2 to 6
Plots of the average z-scored neural responses before (left) and after (right) treatment with tubocurarine (s.d. = shaded area, n=6 fish) for the excitatory (green) and inhibitory (magenta) clusters identified previously. Ten repetitions of a 450mW OT were used as stimuli. B. Histogram of the number of ROIs in each individual fish for the excitatory (top) and inhibitory (bottom) clusters, before (blue) and after (orange) tubocurarine treatment. C. Distribution of the responses from the excited (green) cluster in A, colored by treatment state as in B. D. Distribution of the responses from the inhibited (purple) cluster in A, colored by treatment state as in B. E. Eye movement amplitude before (blue) and after (orange) tubocurarine treatment. F. Tail movement amplitude before (blue) and after (orange) tubocurarine treatment. Shaded area indicates s.d., and n=5 for behavioral data in E and 4 in F.