- Title
-
Luminance Changes Drive Directional Startle through a Thalamic Pathway
- Authors
- Heap, L.A.L., Vanwalleghem, G., Thompson, A.W., Favre-Bulle, I.A., Scott, E.K.
- Source
- Full text @ Neuron
|
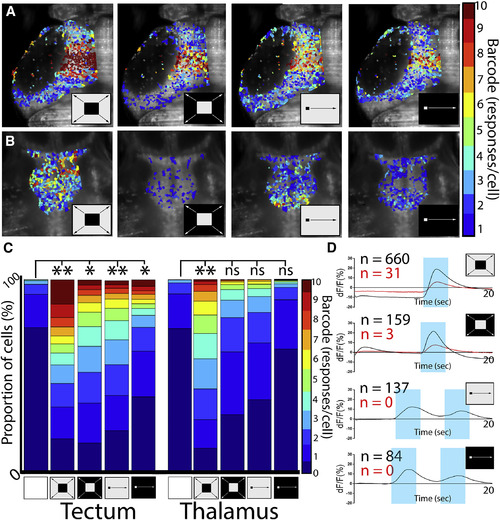
The Thalamus Is Selectively Responsive to Dark Looming Stimuli (A and B) Bar code analysis of individual ROI response rates to ten stimulus presentations in (A) the tectum and (B) the thalamus (stimulus icons represent dark loom, light loom, dark moving spot, and light moving spot, from left to right, and are maintained throughout the rest of the figures). For clarity, nonresponding ROIs are not shaded. The tectum had clear responses to loom stimuli and moving spots in both light/dark configurations (A). The only consistent response of the thalamus was to the dark loom (B). (C) Across 12 larvae, these responses were significant versus spontaneous activity for all stimuli in the tectum but only for the dark loom in the thalamus. (D) By plotting the average of all calcium traces in all 10 responsive ROIs in the tectum (black) and thalamus (red), we see no notable differences in response timing or magnitude across stimuli. ∗p < 0.05, ∗∗p < 0.005 (two-sample Kolmogorov-Smirnov test with Bonferroni-Holm correction for multiple comparisons). |
|
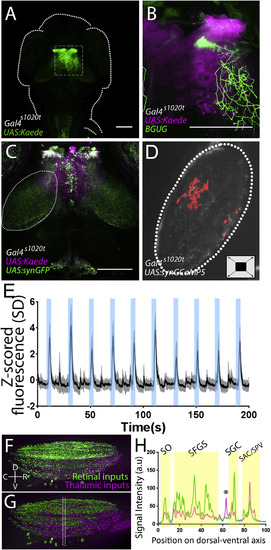
Thalamic Projection Neurons Deliver Loom Information to the Tectum (A) Strong Kaede expression is present in the thalamus of a Gal4s1020t; UAS:Kaede larva (a z series of this expression pattern can be found in Video S2). (B) An individual thalamic projection neuron, revealed using the Brn3c:Gal4;UAS:GFP transgene (Scott et al., 2007), ramifies broadly in the tectal neuropil (a 3D rotation of this cell can be found in Video S3). (C) Expressing a synaptically targeted GFP under the control of Gal4s1020, we see presynaptic terminals of thalamic projection neurons in the tectal neuropil (white outline; a z series is shown in Video S4). (D) By expressing GCaMP in these terminals (in Gal4s1020;UAS:synGCaMP5g larvae), we can gauge when communication is taking place. The location of the presynaptic activity of thalamic axons in the tectal neuropil during looming stimuli in these animals is shaded red. (E) Activity in these synaptic terminals during ten looming stimuli (shaded in blue) across all animals (shading indicates S.D., n = 5). (F) A z projection of the tectal neuropil, rotated perpendicular to the field of view. Green indicates RGC axons, and magenta shows thalamic projection neurons. (G and H) Imaris rendering of (F) (an animation of this rendering can be found in Video S5). The space between the lines in (G) indicates the area sampled to produce a dorsal-ventral map (H) of thalamic projections registered against those from the retina. RGC-defined laminae are indicated with yellow shading, and a thalamo-recipient lamina between the SFGS and SGC is indicated by an asterisk. SO, stratum opticum; SFGS, stratum fibrosum et griseum superficiale; SGC, stratum griseum centrale; SAC/SPV: stratum album centrale and stratum griseum periventriculare. Scale bars indicate 100 μm. |
|
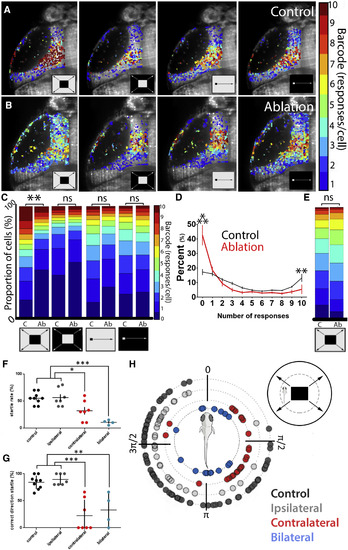
Circuit-Level and Behavioral Effects of Thalamo-Tectal Tract Ablations (A and B) Responses in the tectum of a control larva (A) and a larva with an ablation of the thalamo-tectal tract (B). For both conditions, four stimuli (looms and moving spots in both light-dark configurations) were presented ten times each, resulting in a bar code representing the number of times each ROI responded to a stimulus. (C) Ablations led to a drop in tectal responses specifically to dark looms. (D) Comparing the number of responses in control (black) and ablated (red) animals shows that the change in distribution seen in (C) is due to an increase in the number of nonresponsive ROIs and a decrease in the number of ROIs responding twice or more. These effects are significant for ROIs responding 0 of 10 and 10 of 10 times. (E) Ablations did not affect thalamic loom responses. (F) Startle rates for control larvae (black) and larvae with ipsilateral (gray), contralateral (red), and bilateral (blue) ablations of the thalamo-tectal tract. (G and H) Proportion of startle responses where the larva swims away from the source of the loom stimulus (G, between π and 2π in H). The exact directions of individual startle events are illustrated in (H), with the stimulus approaching from the right (control, p = 7.67E−04; ipsilateral, p = 2.24E−05; contralateral, p = 0.0026; bilateral, p = 0.8036 versus null distribution). A schematic of the experimental setup is illustrated in the top right corner of (H). For calcium imaging, n = 12 controls and 6 ablation animals. An example of the behavioral responses in different ablation conditions can be found in Video S6. For behavioral data, n = 9 control, 7 unilateral ablations, and 5 bilateral ablation animals. ∗p < 0.05; ∗∗p < 0.01, ∗∗∗p < 0.001. Error bars represent SEM. Statistics in (C)–(E): two-sample Kolmogorov-Smirnov test with Bonferroni-Holm correction for multiple comparisons. Statistics for (F) and (G): one-way ANOVA with Dunn’s multiple comparisons test. Statistics for (H): exact binomial test, two-tailed. |
|
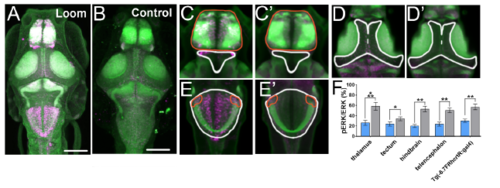
Brain-wide detection of activity resulting from visual loom stimuli. Magenta shows pERK and green shows total ERK (tERK) in larvae subjected to looms (A) and in control larvae (B). For animals exposed to looming stimuli, heightened pERK was observed in the ventral thalamus (white outline in (C) and (C’)), telencephalon (red outline, (C) and (C’)), tectum (white outline, (D) and (D’)), and hindbrain, including within the rhombencephalic expressing region of Tg(-6.7FRhcrtR:gal4) (white and red outlines, (E) and (E’)). In animals subjected to looms, the ratio of pERK to tERK (F) was significantly elevated in each of these brain regions (control larvae in blue, larvae exposed to looms in grey, error bars indicate SEM). n = 5 for controls and 6 for loom-treated animals. Student’s t-test with Bonferroni-Holm correction for multiple comparisons, * = >0.05, ** = >0.01, *** = >0.001. A z-series of this registered brain can be found in Supplemental Movie 1. Scale bars indicate 100μm. |
|
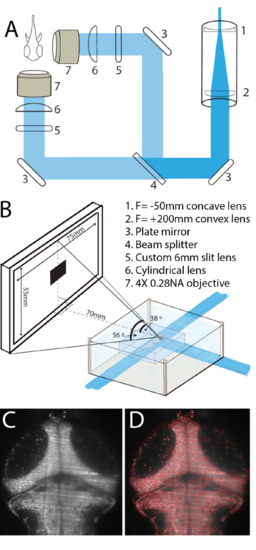
Optical setup for functional imaging during visual stimulation. (A) The selective plane illumination microscope (SPIM) setup used for all experiments. (B) Animals were placed in a custom-built chamber, embedded in agarose, with light from the SPIM entering from the front and side. A 75 X 55mm screen was placed 70mm from the animal for visual stimulation. (C) An example image of the tectum taken on the SPIM setup in (A), and the corresponding watershed segmentation of this image (D). |
|
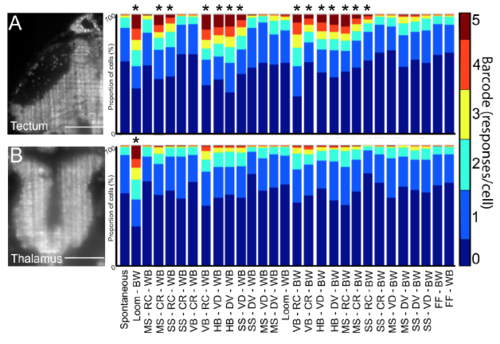
Tectal and thalamic responses to diverse visual stimuli. Barcoded population responses to visual stimuli are shown for the tectum (A) and the thalamus (B). For each of 28 visual stimuli (bottom) the proportion of ROIs responding 0-5 times during five presentations of each stimulus is indicated. Several of these stimuli elicited significant responses above spontaneous baseline for populations of tectal ROIs ((A), right). In contrast, only the dark looming stimulus (second bar, right side of (B)) elicited a significant population response from thalamic ROIs. Abbreviations: BW = black on white, WB = white on black, MS = medium (7 degree) spot, SS = small (3 degree) spot, HB = horizontal bar, VB = vertical bar, RC = rostral-caudal, CR = caudal-rostral, DV = dorsal-ventral, VD = ventral-dorsal, FF = full field flash. * = p<0.05, determined with 2-way ANOVA test with Dunnett test for multiple comparisons. n = 12 larvae, scale bars indicate 50μm. |
|
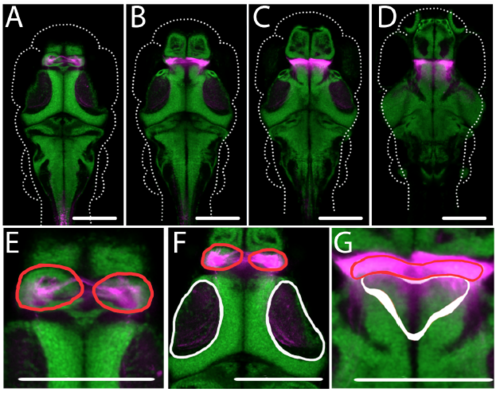
Thalamic expression in Gal4s1020t. Expression of Kaede (magenta), averaged across five animals of the genotype Gal4s1020t; UAS:Kaede, is registered against cell nuclei (green) from the Zbrain atlas (Randlett, Wee et al. 2015). (A-D) show horizontal optical sections through the brain at four dorsal to ventral positions, and selected close-ups are shown in (E-G). Gal4 expression is notable in the habenulae ((A) and (B), red outlines in (E) and (F)), the tectal neuropil ((B), white outline in (F)), sparsely in the dorsal thalamus ((C), white outline in (G)), and the ventral thalamus ((C) and (D), red outlines in (G)). All outlines are derived from the Zbrain atlas (Randlett et al., 2015). Scale bars indicate 100μm. |
|
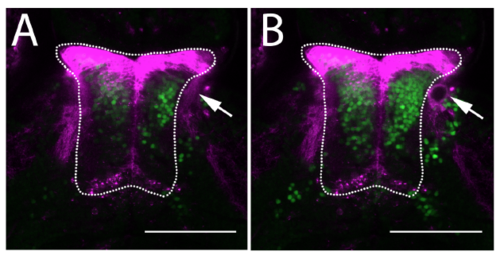
Laser ablation of the thalamo-tectal tract. (A) Images of the thalamus (outline) in a Gal4s1020t;UAS:mCherry; HuC:H2B-GCaMP6f animal before (A) and after (B) laser ablation (arrow) of the tract from the thalamus to the tectum. Magenta shows mCherry and green shows GCaMP6f. Scale bars = 100μm. |

