
|
Fig. S1
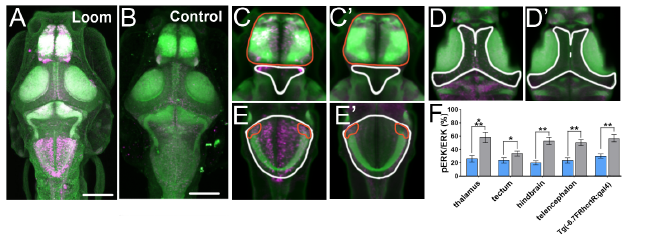
Brain-wide detection of activity resulting from visual loom stimuli.
Magenta shows pERK and green shows total ERK (tERK) in larvae subjected to looms (A) and in control larvae (B). For animals exposed to looming stimuli, heightened pERK was observed in the ventral thalamus (white outline in (C) and (C’)), telencephalon (red outline, (C) and (C’)), tectum (white outline, (D) and (D’)), and hindbrain, including within the rhombencephalic expressing region of Tg(-6.7FRhcrtR:gal4) (white and red outlines, (E) and (E’)). In animals subjected to looms, the ratio of pERK to tERK (F) was significantly elevated in each of these brain regions (control larvae in blue, larvae exposed to looms in grey, error bars indicate SEM). n = 5 for controls and 6 for loom-treated animals. Student’s t-test with Bonferroni-Holm correction for multiple comparisons, * = >0.05, ** = >0.01, *** = >0.001. A z-series of this registered brain can be found in Supplemental Movie 1. Scale bars indicate 100μm.