
|
Fig. 3
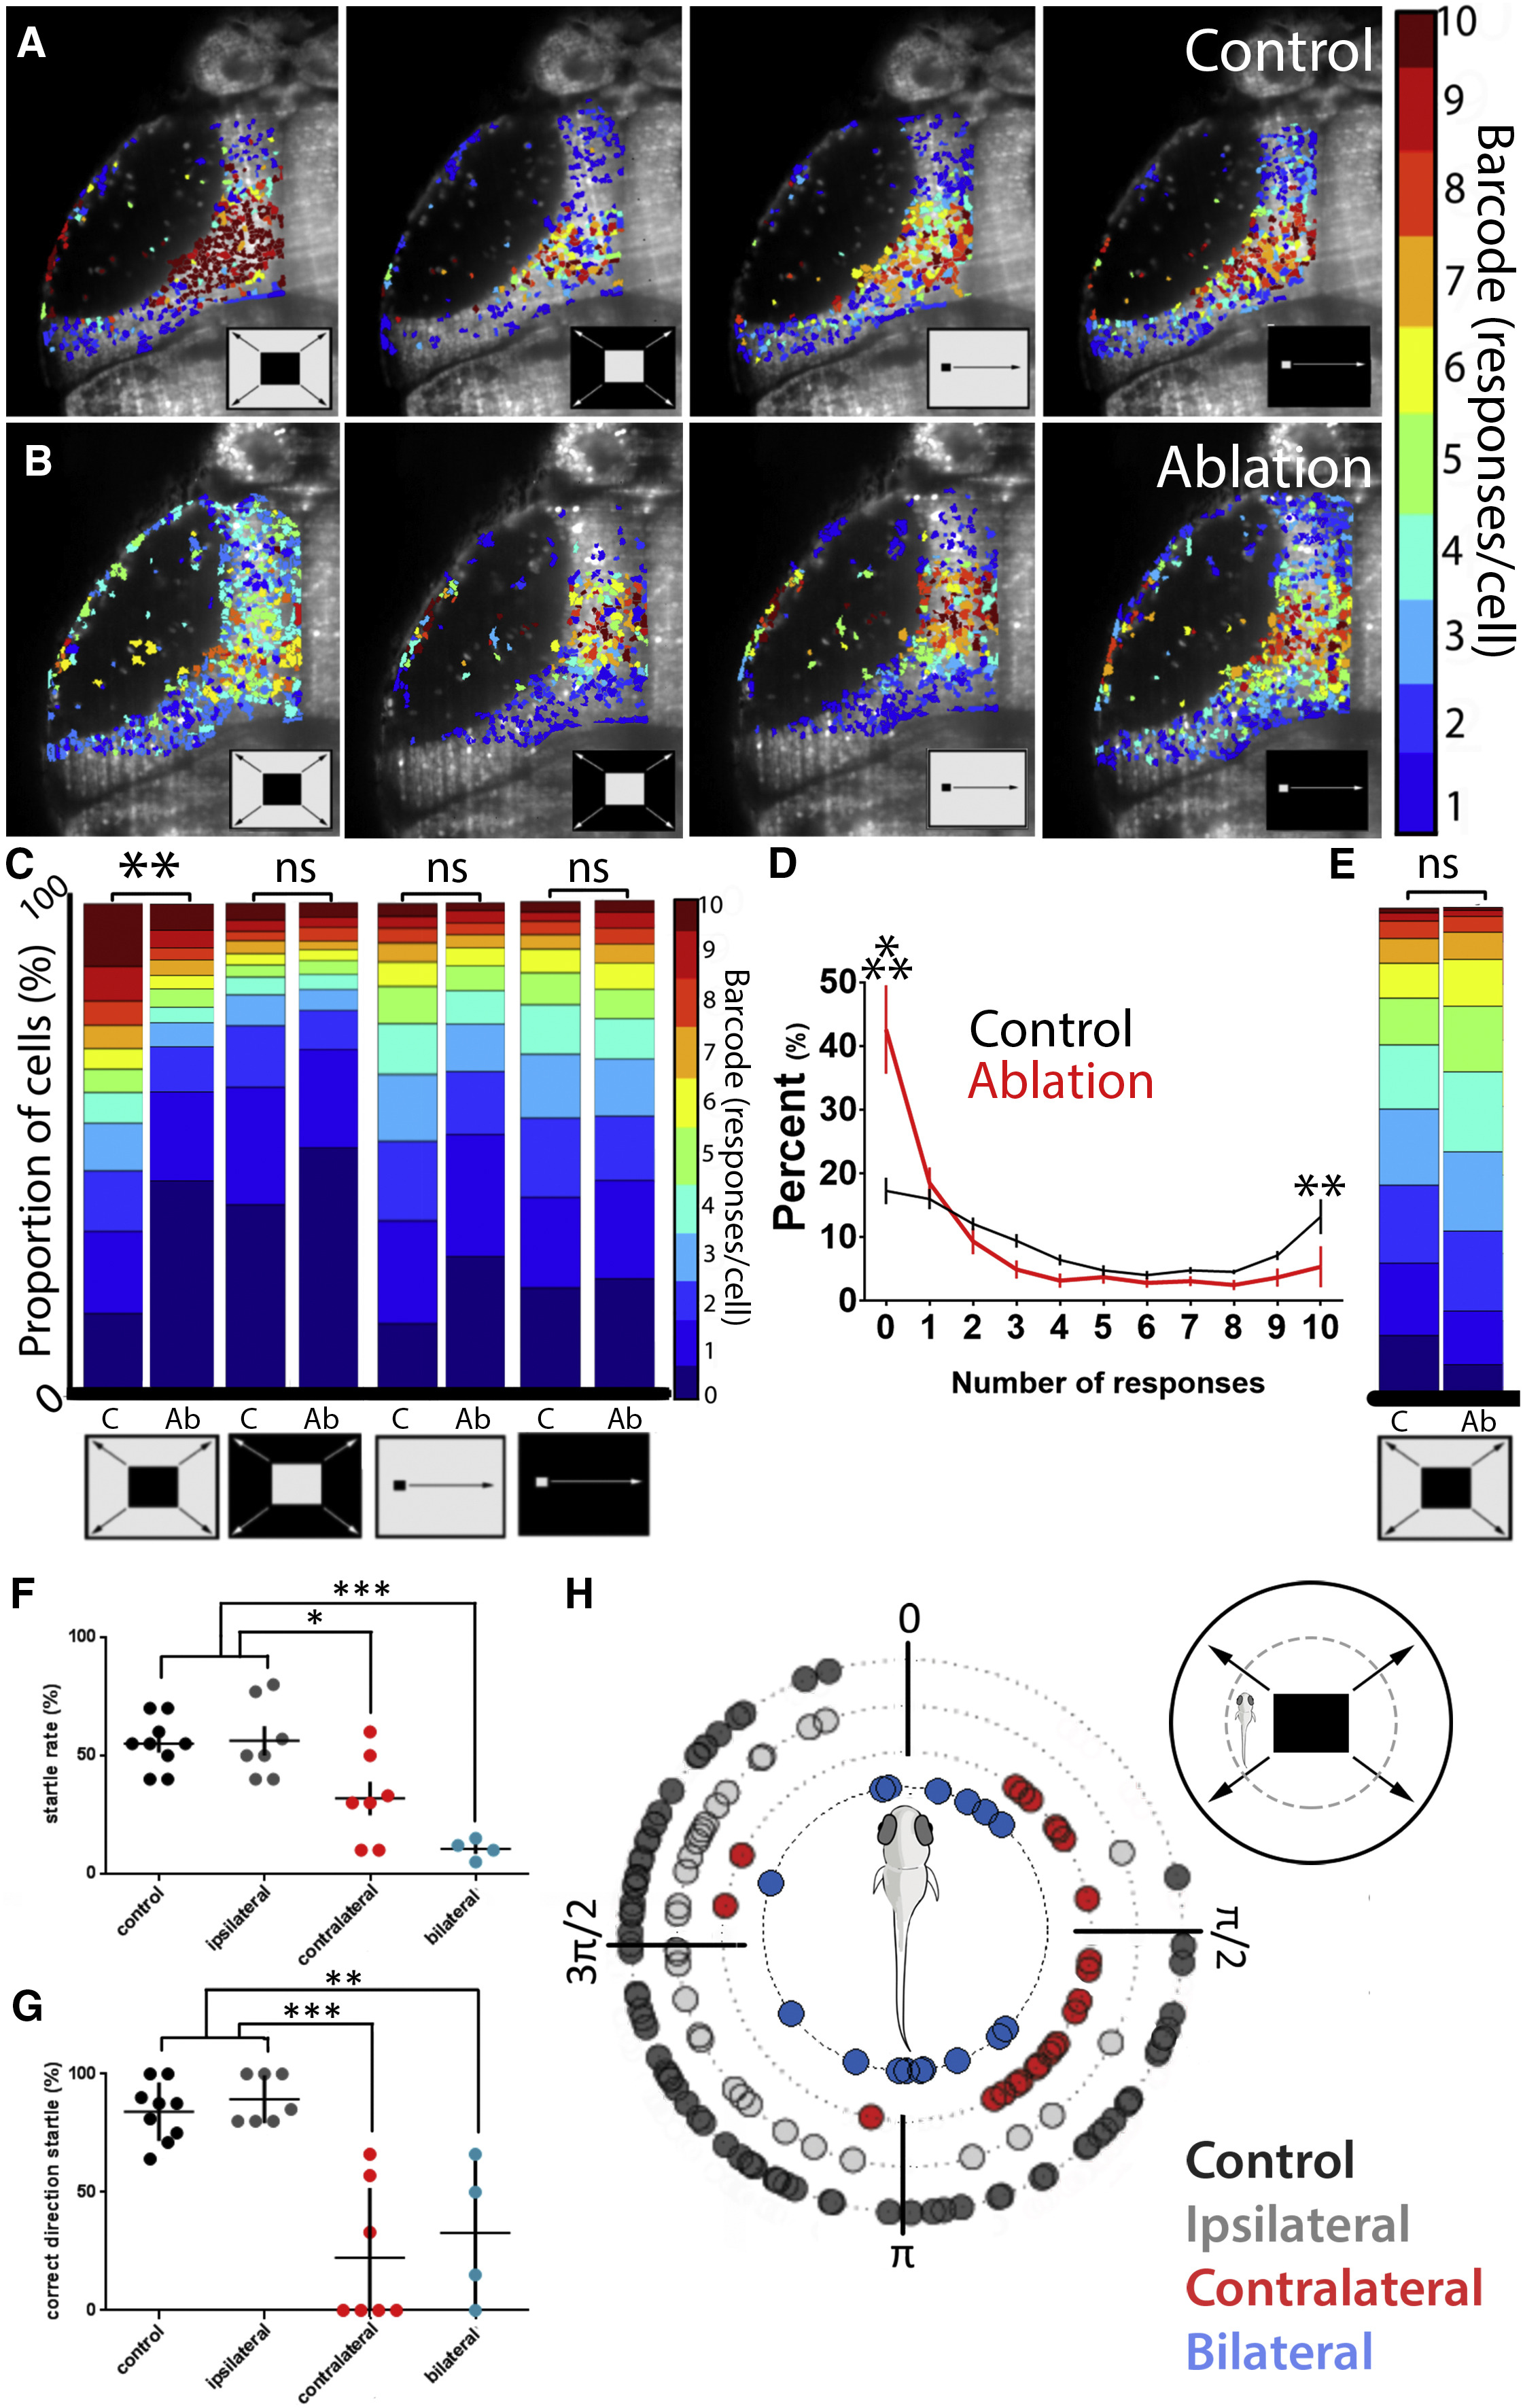
Circuit-Level and Behavioral Effects of Thalamo-Tectal Tract Ablations
(A and B) Responses in the tectum of a control larva (A) and a larva with an ablation of the thalamo-tectal tract (B). For both conditions, four stimuli (looms and moving spots in both light-dark configurations) were presented ten times each, resulting in a bar code representing the number of times each ROI responded to a stimulus.
(C) Ablations led to a drop in tectal responses specifically to dark looms.
(D) Comparing the number of responses in control (black) and ablated (red) animals shows that the change in distribution seen in (C) is due to an increase in the number of nonresponsive ROIs and a decrease in the number of ROIs responding twice or more. These effects are significant for ROIs responding 0 of 10 and 10 of 10 times.
(E) Ablations did not affect thalamic loom responses.
(F) Startle rates for control larvae (black) and larvae with ipsilateral (gray), contralateral (red), and bilateral (blue) ablations of the thalamo-tectal tract.
(G and H) Proportion of startle responses where the larva swims away from the source of the loom stimulus (G, between π and 2π in H). The exact directions of individual startle events are illustrated in (H), with the stimulus approaching from the right (control, p = 7.67E−04; ipsilateral, p = 2.24E−05; contralateral, p = 0.0026; bilateral, p = 0.8036 versus null distribution). A schematic of the experimental setup is illustrated in the top right corner of (H). For calcium imaging, n = 12 controls and 6 ablation animals. An example of the behavioral responses in different ablation conditions can be found in Video S6. For behavioral data, n = 9 control, 7 unilateral ablations, and 5 bilateral ablation animals. ∗p < 0.05; ∗∗p < 0.01, ∗∗∗p < 0.001. Error bars represent SEM.
Statistics in (C)–(E): two-sample Kolmogorov-Smirnov test with Bonferroni-Holm correction for multiple comparisons. Statistics for (F) and (G): one-way ANOVA with Dunn’s multiple comparisons test. Statistics for (H): exact binomial test, two-tailed.