
|
Fig. S4
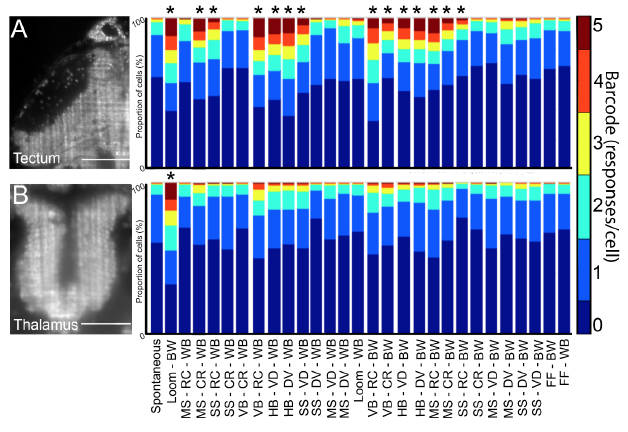
Tectal and thalamic responses to diverse visual stimuli.
Barcoded population responses to visual stimuli are shown for the tectum (A) and the thalamus (B). For each of 28 visual stimuli (bottom) the proportion of ROIs responding 0-5 times during five presentations of each stimulus is indicated. Several of these stimuli elicited significant responses above spontaneous baseline for populations of tectal ROIs ((A), right). In contrast, only the dark looming stimulus (second bar, right side of (B)) elicited a significant population response from thalamic ROIs. Abbreviations: BW = black on white, WB = white on black, MS = medium (7 degree) spot, SS = small (3 degree) spot, HB = horizontal bar, VB = vertical bar, RC = rostral-caudal, CR = caudal-rostral, DV = dorsal-ventral, VD = ventral-dorsal, FF = full field flash. * = p<0.05, determined with 2-way ANOVA test with Dunnett test for multiple comparisons. n = 12 larvae, scale bars indicate 50μm.