- Title
-
A novel inducible mutagenesis screen enables to isolate and clone both embryonic and adult zebrafish mutants
- Authors
- Ma, Z., Zhu, P., Pang, M., Guo, L., Chang, N., Zheng, J., Zhu, X., Gao, C., Huang, H., Cui, Z., Xiong, J.W., Peng, J., Chen, J.
- Source
- Full text @ Sci. Rep.
|
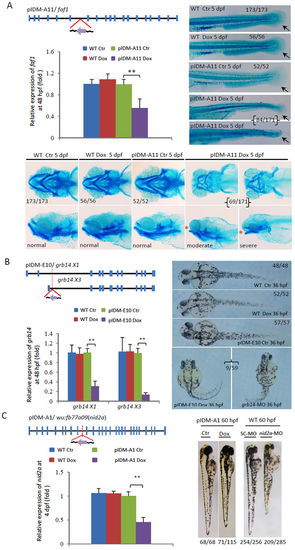
Dox-dependent down-regulation of genes in three example mutants causes abnormal embryonic development. (A) Line pIDM-A11. pIDM-A, a β-act promoter was used to drive rtTA and Egfp genes. Diagram showing the position and orientation of pIDM in the faf1 genomic DNA. Black line, intron or intergenic DNA; Blue vertical bar, exon; Purple arrow, direction of Tet-on promoter; Red lines, position of the insertion. Total RNA was extracted at 48 hpf. The relative expression of the faf1 transcript was analyzed with qRT-PCR. β-actin was used to normalize the total RNA. The embryos treated and untreated with Dox (Ctr) were sampled at 5 dpf and subsequently subjected to alcian-blue-staining for fin (Top right panel) and pharyngeal cartilage (Bottom panel). Black arrow, position of caudal fin; Red star, ‘open-mouse’ phenotype. (B) Line pIDM-E10. pIDM-E, an elf1a promoter was used to drive rtTA and Egfp genes. Diagram of the position and orientation of pIDM in the grb14 genomic DNA (including two isoforms grb14X1 and X3). The relative expression level of grb14X1 and X3 transcripts was analyzed by qRT-PCR with specific primers at 48 hpf. Pictures of WT and mutant embryos with different treatments at 36 hpf as indicated, noting that grb14-MO morphants had similar defects as that in pIDM-E10 transgenic embryos upon Dox induction. (C) Line pIDM-A1. Diagram of the position and orientation of pIDM in the wu:fb77a09(nid2a) genomic DNA. The relative expression level of the nid2a transcript was analyzed at 4 dpf. Pictures of WT and mutant embryos with differing treatments at 60 hpf as indicated. In A, B and C, representative embryos are shown, the number of embryos showing the displayed phenotype versus total embryos examined are provided in the corresponding panels. All statistically significant differences between samples were assessed with the independent-samples T-test (*P < 0.05, **P < 0.01, ***P < 0.001). |
|
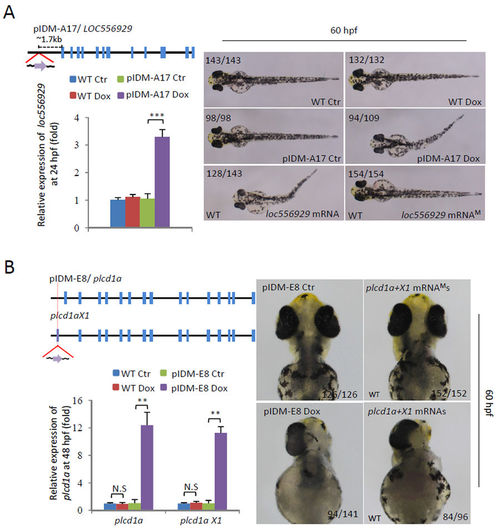
Dox-dependent up-regulation of genes in two example mutants causes abnormal embryonic development. (A) Line pIDM-A17. Upper left panel: Diagram showing the position and orientation of pIDM in loc556929 genomic DNA. Bottom left panel: The relative expression level of the loc556929 transcript upon Dox-treatment was analyzed at 24 hpf. Right panel: Pictures of WT and mutant embryos with different treatments at 60hpf as indicated, noting that over-expression of wild-type loc556929 mRNA, but not mutant loc556929 mRNAM, phenocopied embryonic defects in pIDM-A17 transgenic embryos after Dox induction. (B) Line pIDM-E8. Upper left panel: Diagram showing the position and orientation of pIDM in the plcd1a genomic DNA (including two isoforms plcd1a andX1). Bottom left panel: The relative expression levels of plcd1a and X1 transcripts upon Dox-treatment was analyzed with specific primers at 48 hpf. Right panel: Pictures of WT and mutant embryos with differing treatments at 60 hpf as indicated, noting that over-expression of wild-type plcd1a + X1 mRNAs, but not plcd1a + X1 mRNAMs, phenocopied embryonic defects including a single eye in pIDM-E8 transgenic embryos after Dox treatment. In A and B, representative embryos are shown, the number of embryos showing the displayed phenotype versus total embryos examined are provided in the corresponding panels. |
|
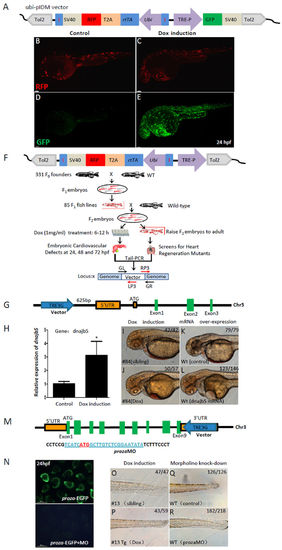
The inducible dominant mutagenesis is validated in a more focused genetic screen for cardiovascular mutants. (A) A modified pIDM vector (ubi-pIDM) for testing Dox-induced GFP expression. GFP is located downstream to TRE3G promoter, rtTA and transgenic reporter RFP are driven by the ubi promoter, of which rtTA and RFP are linked by T2A, and the ubi-rtTA-T2A-RFP cassette is flanked by a pair of insulators. (B–E) Transgenic reporter RFP of F1 embryos were expressed in both control (B) and Dox-induced (C) embryos. GFP was hardly expressed in control group (D) but highly induced by Dox (E). (F) Schematic of the screen strategy for cardiovascular mutants. F0 founders were crossed with WT to establish F1 transgenic zebrafish. The F1 transgenic fish with RFP was crossed with WT to get F2 embryos. The F2 embryos were divided into two groups, one treated with Dox at 6–12 hpf for screening cardiovascular defects, and another one for raising F2 embryos into adults. (G) The ubi-pIDM vector insertion is located at 625 bp upstream to the 5 ‘UTR of dnajb5 in #84 line. (H) RT-PCR showed that dnajb5 mRNA was 3 times more after Dox induction. *p < 0.05. (I–L) #84Tg had cardiovascular defects (J) compared with WT siblings (I) at 48 hpf after Dox induction. Embryos injected with dnajb5 mRNA (0.1ng) (L) mimicked the phenotypes of Dox treated #84Tg embryos. Lower right numbers show phenotypical embryos out of total embryos analyzed. (M–R) Cartoon shows the ubi-pIDM vector position in the 3 ‘UTR of proza in Chr. 3 in #13 line. The proza 5′UTR sequence was used to drive EGFP expression, the start code ATG of proza is in red and underlined, and the prozaMO sequence is underlined (M). The proza:EGFP reporter was expressed in control embryos (upper panel) that was inhibited by prozaMO (4 ng) (lower panel) at 24 hpf. (O–R) #13 transgenic embryos (#13Tg) showed no blood circulation and abnormal tail development (P) compared with #13 control siblings (O) after Dox induction. Morphant embryos with 4 ng prozaMO showed developmental defects (R) similar to that in #13Tg embryos (P) at 48 hpf. |
|
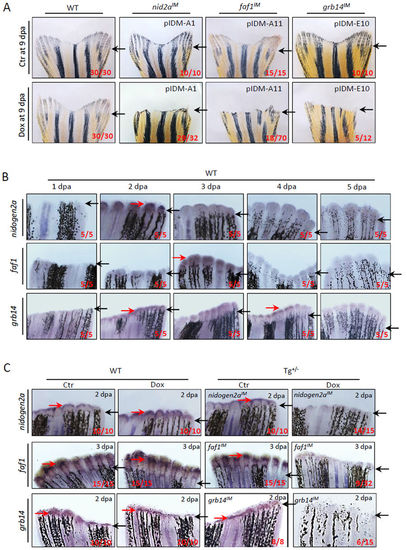
Dox-induced down-regulation of genes in three single-inserted example mutants inhibits adult caudal fin regeneration. (A) Adult caudal fin failed to regenerate after Dox-treatment in three mutant lines pIDM-A1 (nid2a), pIDM (faf1), and pIDM (grb14) at 9 days post amputation (dpa). Black arrow, cutting site. (B) All three genes were induced in wild-type caudal fins after amputation. The WT caudal fin was sampled at indicated time points after amputation and subjected to a WISH assay with the corresponding anti-sense RNA probes as indicated. Black arrow, cutting site; Red arrow, positive signal. (C) Dox-induced down-regulation of the entrapped genes is found in respective transgenic mutant lines compared with wild-type fins with or without Dox or control transgenic fins without Dox by WISH assay. The amputated caudal fin was sampled at 2 or 3 dpa. Black arrow, cutting site; Red arrow, positive signal. In a–c, representative fish are shown, the number of fish showing the displayed phenotype versus total fish examined are provided in the corresponding panels. |
|
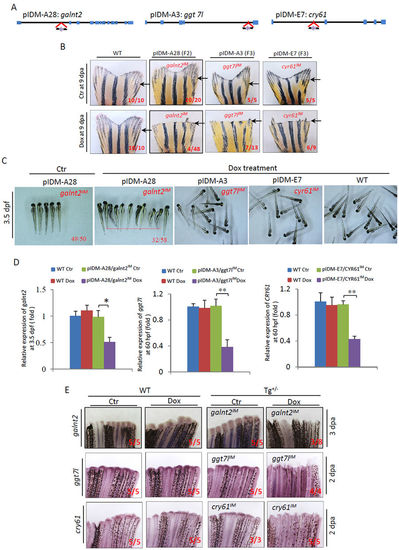
Three single-insertion mutant lines, segregated from multiple insertions, have adult caudal fin regeneration defects after amputation. (A) Diagram showing three single-inserted pIDMs in the galnt2, ggt7l and cry61genomic DNAs segregated from lines pIDM-A28, A3 and E7. (B) Fin regeneration defects upon Dox-treatment in pIDM-A28 F2 mutants with single-insertion galnt2 IM, pIDM-A3 F3 mutants with single-insertion ggt7l IM, and pIDM-E7 F3 mutants with single-insertion cry61l IM as indicated. The experiments were performed as described in Fig. 4A. Black arrow, cutting site. (C) Images showing WT and mutant embryos of the three single-insertion lines upon Dox treatment at 3.5 dpf as indicated. (D) The relative expression level of galnt2, ggt7l and cry61 transcripts decreased in segregated mutant embryos at 3.5 dpf upon Dox treatment as indicated. (E) Down-regulation of the entrapped gene expression was found in respective segregated mutant lines upon Dox-treatment as indicated time points. The amputated caudal fin was sampled at 2 or 3 dpa. In B, C and E, representative fish are shown, the number of fish showing the displayed phenotype versus total fish examined are provided in the corresponding images. |
|
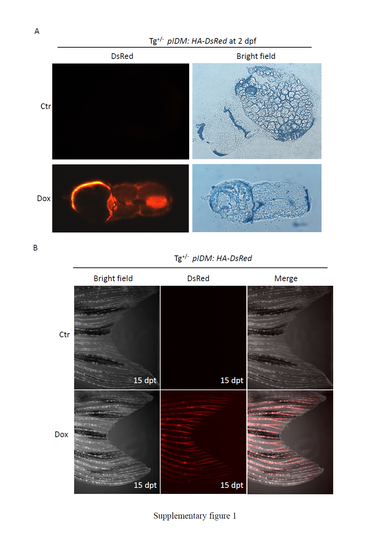
The expression of HA-DsRed was induced by Dox treatment in the transgenic embryonic and adult fish harboring the modified pIDM:HA-DsRed transgene. (A) Transgenic zebrafish were generated as described in Figure 1B. Transgenic embryos were treated with Dox at 12 hpf. The treated and untreated embryos at 2 dpf were fixed with 4% PFA for 1 hour and then subjected to cryo-sections. The photo was taken with a fluorescent microscope. (B) Three-month-old transgenic fish were treated with Dox. The picture was taken under a confocal microscope at 15 dpt. Tg+/-, heterozygous transgenic fish; Ctr, untreated control. |
|
Improvement of the pIDM system by including the combination of a pair of insulators. (A) Diagram of the first generation pIDM vector. The abbreviations for each item in the first generation pIDM construct are the same as those in the improved pIDM construct (Figure 1A), except where it lacks the pair of insulators. (B) Frequencies of F0 founder fish with visible fluorescent F1 progenies. F0 transgenic founder fish were generated with either the first generation or improved pIDM constructs. F1 population containing visible green fluorescent embryos was considered to be positive transgenic lines. (C) The line on the left presented most transgenic lines generated with the first generation pIDM and the line on the right presented most transgenic lines generated with the improved pIDM. The picture was taken at 36 hpf. Red arrow, embryo without visible fluorescence. (D) Identification of transgene by PCR using rtTA-transgenic-fish-ID-for and rtTA-transgenic-fish-ID-rev primer pairs in F1 transgenic embryos generated with the first generation pIDM. Genomic DNA was extracted from WT embryos and F1 embryos either presence or absence of fluorescence. The plasmid DNA of pIDM (plasmid) was used as a positive control. (E) The inclusion of the insulator in pIDM sharply decreased the leakage of the Tet-on promoter. Upper panel: Diagram showing two types of vectors under analysis, either without or with a pair of insulators. In this construct, we used DsRed as the reporter gene and Egfp as the inducible gene. Lower panels: Western blot analysis of EGFP. The plasmid was injected into WT embryos at the one-cell stage. The injected embryos were treated with Dox at 12 hpf. Total protein was extracted at 8, 18 or 24 hpt. An EGFP antibody was used to detect EGFP protein. β-actin was used as the protein loading control. |
|
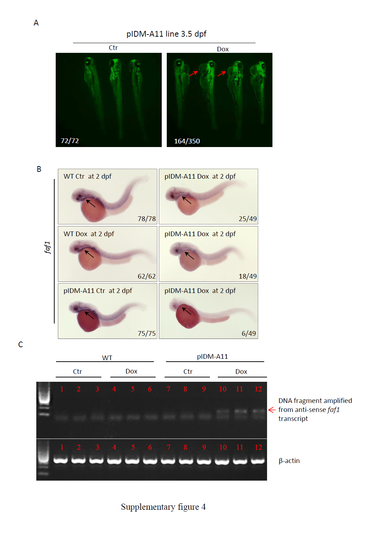
Supplementary information for line pIDM-A11. (A) The F1 pIDM-A11 embryos were treated with Dox at 12 hpf. The picture was taken at 3.5 dpf. Red arrow: pericardial edema. Number, type of represented embryos /total embryos in F1 population. (B) Reduction of the faf1 expression in the pIDM-A11 embryos treated with Dox. The treated embryos were sampled at 2 dpf and subjected to whole mount in situ hybridization (WISH). Anti-sense RNA of faf1 was used to perform WISH. Black arrow, pharyngeal arch. Number, type of represented embryos/total embryos in F2 population. (C) Induction of anti-sense transcript of faf1 in the pIDM-A11 embryos treated with Dox. Total RNA was sampled at 2 dpf. The anti-sense faf1 transcript was analyzed with quantitative reverse transcription PCR (qRT-PCR). The qRT-PCR in each treatment was repeated three times. β-actin was used as the qRT-PCR positive control. Red arrow, DNA fragment was amplified from anti-sense faf1 transcript. |
|
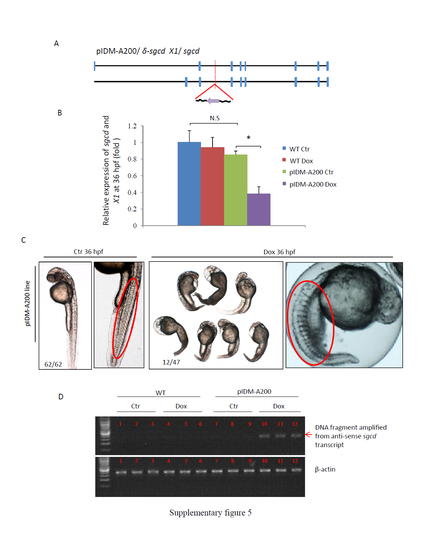
Supplementary information for line pIDM-A200. (A) Diagram showing the position and orientation of pIDM in the δ-sgcd genomic DNA (including two isoforms, δ-sgcd and X1). (B) The relative expression levels of total δ-sgcd and X1 transcripts were analyzed with specific primers at 48 hpf. β-actin was used to normalize the total RNA. (C) Pictures of pIDM-A200 embryos treated or untreated with Dox at 36 hpf. The enlarged pictures showed the abnormal muscular development phenotype (red oval). Number, type of represented embryos/total embryos in F2 population. (D) The induction of the anti-sense transcript of sgcd in the pIDM-A200 embryos treated with Dox was analyzed with qRT-PCR using primer pairs sgcd-intron2-F and sgcd-intron2-R. For all analysis on the relative expression of the target genes the statistically significant differences between samples were assessed using independent-sample T-tests (*P<0.05, **P<0.01, ***P<0.001). |
|
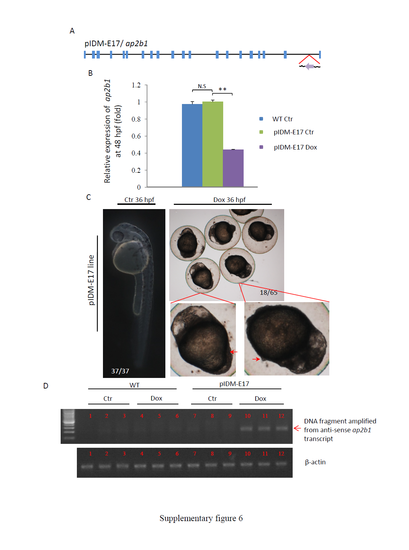
Supplementary information for line pIDM-E17. (A) Diagram showing the position and orientation of pIDM in the ap2b1 genomic DNA. (B) The relative expression level of the ap2b1 transcripts was analyzed with specific primers ap2b1-F and ap2b1-R at 48 hpf. β-actin was used to normalize the total RNA. (C) Pictures of pIDM-E17 embryos treated or untreated with Dox at 36 hpf. Red arrow, extruded-yolk. Number, type of represented embryos/total embryos in F2 population. (D) The induction of the anti-sense transcript of ap2b1 in the pIDM-E17 embryos treated with Dox was analyzed with qRT-PCR using primer pairs ap2b1-intron21-F and ap2b1-intron21-R. |
|
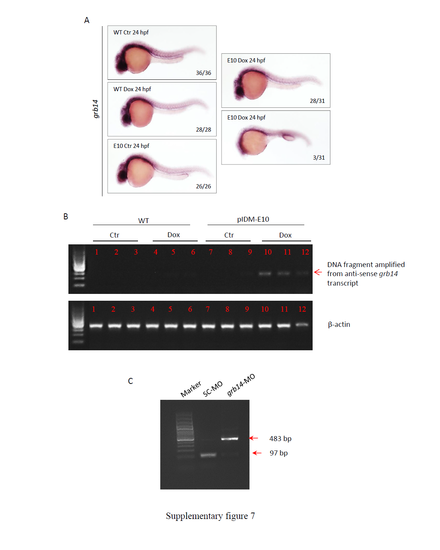
Supplementary information for line pIDM-E10. (A) Reduction of the grb14 expression in the pIDM-E10 embryos treated with Dox. The treated embryos were sampled at 24 hpf and subjected to WISH. Anti-sense RNA of grb14 was used to perform WISH. Number, type of represented embryos/total embryos in F2 population. (B) Induction of the anti-sense transcript of grb14 in the pIDM-E10 embryos treated with Dox was analyzed with qRT-PCR using the primer pairs grb14-intron2-F and grb14-intron2-R. (C) RT-PCR analysis showed that, due to abnormal splicing, the grb14 morpholino (grb14-MO) had created an aberrant transcript with the extra 386 nt. WT embryos injected with the standard control morpholino (SC-MO) were used as the control. |
|
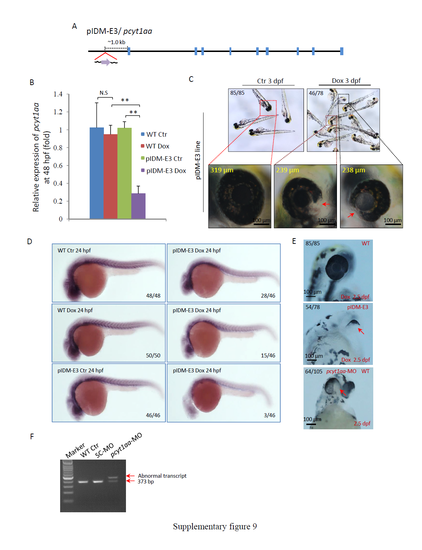
Supplementary information for line pIDM-E3. (A) Diagram showing the position and orientation of pIDM in the pcyt1aa genomic DNA. (B) The relative expression levels of the pcyt1aa transcript were analyzed with specific primers pcyt1aa-F and pcyt1aa-R at 48 hpf. β-actin was used to normalize the total RNA. (C) Pictures of pIDM-E3 embryos treated or untreated with Dox at 3 dpf. The diameter of the eyes in the enlarged pictures is shown as a yellow number. Red arrow, less pigmentation in eyes. (D) Reduction of the pcyt1aa expression in the pIDM-E3 embryos treated with Dox. The treated embryos were sampled at 24 hpf and subjected to WISH. Anti-sense RNA of pcy1aa was used to perform WISH. (E) Pictures of WT and pIDM-E3 embryos with different treatments at 2.5 dpf as indicated. pcyt1aa-MO was designed to specifically block pcyt1aa transcript splicing and was injected into WT embryos at the one-cell stage. Red arrow, less pigmentation in eyes. (F) RT-PCR analysis showed that pcyt1aa-MO had created an aberrant transcript of pcyt1aa, due to abnormal splicing. WT embryos and WT embryos injected with SC-MO were used as the control. Numbers in C-E, type of represented embryos/total embryos in F2 population. |
|
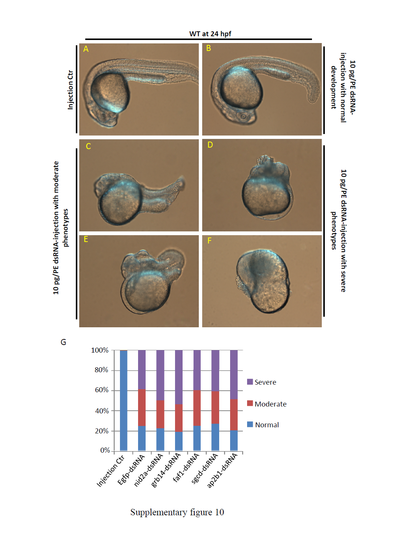
Embryonic abnormalities caused by dsRNA injection. (A-F) WT embryos were injected with 10 pg/per embryo (pg/PE) Egfp dsRNA or nid2a, grb14, faf1, sgcd, ap2b1 dsRNA at the one-cell stage. Embryos injected phenol-red buffer as the injection control (A). Most of embryos injected with all of the 6 dsRNAs showed similar abnormal development. The similar abnormal development can be divided into three categories: Normal development with no obvious phenotypes (B), Moderate phenotypes (C, E) and Severe phenotypes (D, F). (G) Statistics of different types of embryos in each treatment with dsRNA injection. Approximately 300 injected embryos were counted in each treatment. |
|
Dox treated transgenic embryos from either pIDM-anti-faf1 or pIDM-anti-grb14 developed normally and did not display similar phenotypes as Dox treated mutant embryos from either pIDM-A11 or pIDM-E10 did. (A) Diagram of pIDM-anti-faf1 and pIDM-anti-grb14 vectors. The abbreviations for each item in the vectors are the same as those in the pIDM:HA-DsRed construct (Figure 1B), except where HA-DsRed was replaced with either the anti-sense of faf1 or grb14 coding region cDNA. (B) Induction of the anti-sense transcript of faf1 or grb14 in the pIDM-anti-faf1 or pIDM-anti-grb14 embryos treated with Dox was analyzed with qRT-PCR using the primer pairs anti-faf1-qRT-For and –Rev or anti-grb14-qRT-For and -Rev. (C) The relative expression level of the faf1 or grb14 transcripts was analyzed with specific primers faf1-F and faf1-R or grb14-F and grb14-R in different samples as indicated at 2.5 dpf . β-actin was used to normalize the total RNA. (D) The pIDM-anti-faf1 embryos were treated with Dox at 12 hpf. The pictures were taken at 4 dpf (1st and 3rd panels). The embryos treated and untreated with Dox (Ctr) were sampled at 5 dpf and subsequently subjected to alcian-blue-staining for pharyngeal cartilage (2nd and 4th panels). (E) The pIDM-anti-grb14 embryos were treated with Dox at 12 hpf. The pictures were taken at 4 dpf. |
|
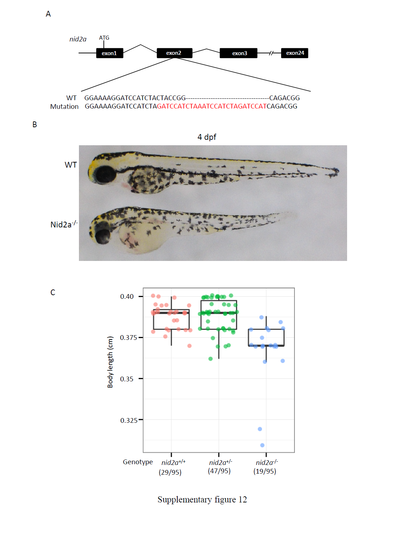
nid2a knockout mutants display similar phenotypes to those in pIDM-A1 embryos upon Dox treatment. (A) Upper panel: Diagram showing the genome structure of nid2a and the gRNA target site. Bottom panel: Comparison of genomic DNA among WT and nid2a-/- mutant (with a 7 bp-deletion and a 27 bp-insertion in the 2nd exon ). ATG: translation start codon. The mutation will lead to an early stop codon. (B) Picture of WT and nid2a homozygous mutant (nid2a-/-) embryos at 4 dpf. (C) Statistics of body length (centimeter cm) of different genotype embryos in a F22 population at 4 dpf as indicated. Numbers: embryos with the genotype versus total embryos in the F22 population examined. |
|
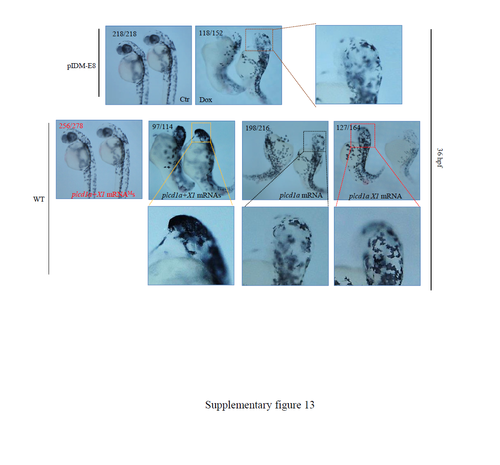
Characterization of line pIDM-E8. Pictures of WT and mutant embryos with differing treatments at 36 hpf as indicated. For mRNA injection, WT embryos were injected with plcd1a mRNA, or plcd1aX1 mRNA, or plcd1a together with plcd1aX1 mRNAs (plcd1a+X1 mRNAs), or both of the mutant mRNAs carrying an early stop codon (plcd1a+X1 mRNAMs) at the one cell stage. Enlarged pictures to show delayed eye’s development. Numbers: embryos showing the displayed phenotype versus total embryos examined are provided in the corresponding pictures. PHENOTYPE:
|
|
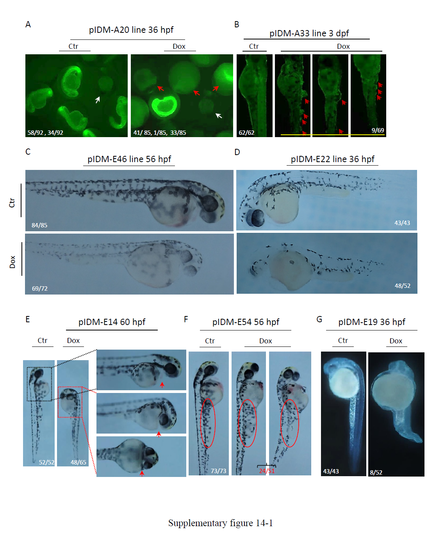
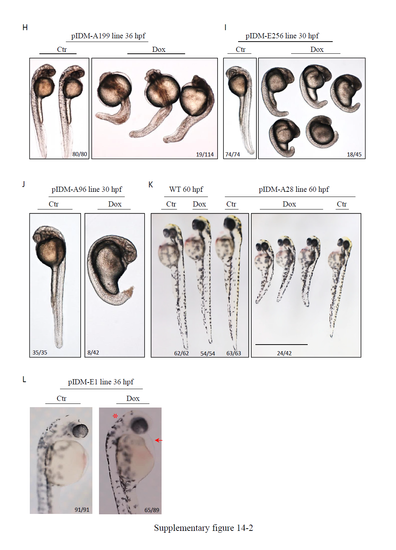
Morphology of Dox treated pIDM mutants with multiple insertions. (A) Line pIDM-A20. Early embryonic lethality for Dox treated pIDM-A20 embryos at 36 hpf. Red arrow, dead embryos; white arrow, WT embryos. In untreated pIDM-A20 embryos, 58 embryos were EGFP positive and 34 embryos were EGFP negative. None of these embryos had died. In Dox treated pIDM-A20 embryos (total 85), 41 embryos were dead at 36 hpf, while among 34 living embryos, only one embryo (with clearly retarded development) was EGFP positive with 33 embryos EGFP negative. (B) Line pIDM-A33. Epidermal blisters in Dox treated pIDM-A33 embryos at 3 dpf. Red arrow, lesions. (C) Line pIDM-E46. Less pigmentation in Dox treated pIDM-E46 embryos at 56 hpf. (D) Line pIDM-E22. Less pigmentation in Dox treated pIDM-E22 embryos at 36 hpf. (E) Line pIDM-E14. Short stature and no pericardium in Dox treated pIDM-E14 embryos at 60 hpf. Red arrow, pericardium. (F) Line pIDM-E54. Shorter and thicker yolk extension in Dox treated pIDM-E54 embryos at 56 hpf. Red ellipse, yolk extension. (G) Line pIDM-E19. Small head, curved body and unabsorbed yolk in Dox treated pIDM-E19 embryos at 36 hpf. (H) Line pIDM-A199. Curved body with severe cell death in Dox treated pIDM-A199 embryos at 36 hpf. (I) Line pIDM-E256. Arrested development in Dox treated pIDM-E256 embryos at 30 hpf. (J) Line pIDM-A96. Arrested development in Dox treated pIDM-A96 embryos at 30 hpf. (K) Line pIDM-A28. Short stature in Dox treated pIDM-A28 embryos at 60 hpf. (L) Line pIDM-E1. Pericardial edema and deformed head in Dox treated pIDM-E1 embryos at 36 hpf. Red arrow, pericardial edema; (*), deformed head. Number in B-L, type of represented embryos/total embryos in F2 population. Details of insertion positions, orientation of pIDM and expression changes of tagged genes in each line are provided in Table 1. |
|
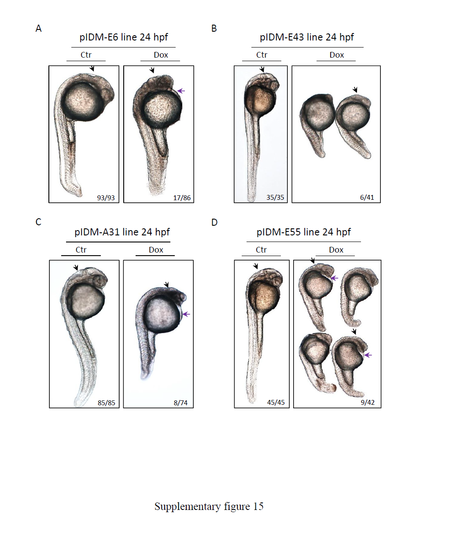
Non-specific phenotypes in Dox treated pIDM mutants with multiple insertions. No-midbrain-hindbrain boundaries, lack of normal brain ventricles, defects in eye development and pericardial edema were observed in Dox treated embryos of pIDM-E6 (A), pIDM-E43 (B), pIDM-A31 (C) and pIDM-E55 (D) lines. Black arrow, brain-boundaries; purple arrow, heart edema. Number in A-D, type of represented embryos/total embryos in F1 population. |
|
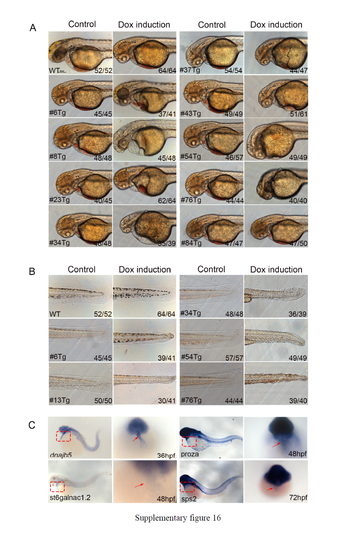
Morphological abnormalities of ubi-pIDM-transgenic embryos after Dox induction. (A-B) Nine mutant lines had Dox-induced cardiovascular defects (A) and five lines had abnormal blood circulation and tail defects (B). Either wild-type (WT; left) or ubi-pIDM transgenic embryos (such as #6Tg; right) were treated with DMSO (control) or Dox (Dox-induction), and cardiovascular, tail and circulation phenotypes were documented at 48 hpf. The numbers on the lower right indicate phenotypical numbers out of the total (C) RNA in situ hybridization revealed that Dnajb5, proza, St6galnac1.2, and sps2 were expressed in the heart on the left column (lateral view), and the ventral view of the heart area is enlarged on the right column. Arrows point to the heart. Staged embryos are noted for dnajb5 at 36 hpf, for proza and st6galnac1.2 at 48 hpf, and for sps2 at 72 hpf. |
|
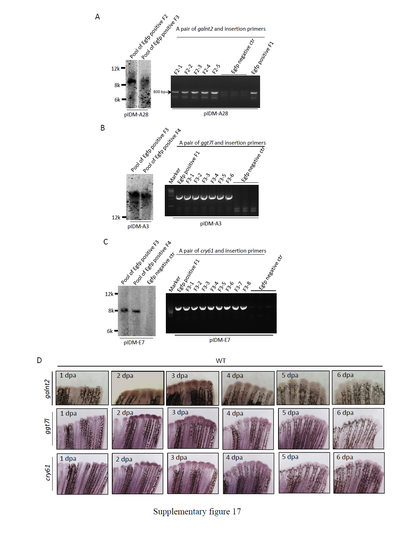
Segregation analysis of causative mutation from the multiple-inserted lines with Dox-dependent fin regeneration defects. (A) Segregation of galnt2IM from line pIDM-A28. To segregate the causative mutation, pIDM-A28 F1 mutants with Dox-dependent fin regeneration defects were crossed with WT. The cross containing about 50% EGFP positive offspring was selected to produce F2 population. Left panel: Southern blot analysis of insertion copy numbers in the pool of embryos as indicated. Pool of EGFP positive F2: The F2 EGFP positive embryos were from the cross between the selected F1 fish and WT; Pool of EGFP positive F3: The F3 EGFP positive embryos were from the cross between one of F2 adult fish and WT. Southern blot was performed as described in Supplementary Figure 3. Right panel: PCR analysis to identify the insertion site. A pair of galnt2 intron 1 and pIDM specific primers were designed to amplify the insertion site. The DNA lysed from caudal fin of individual F2 fish was used to do PCR analysis. The DNA from EGFP positive F1 embryo pool was used as the positive control. The DNA from EGFP negative F2 fish was used as the negative control. (B) Induction of the listed genes in WT zebrafish at different time points during fin regeneration as indicated. The WT caudal fin was sampled at different times after amputation and subjected to a WISH assay with the corresponding anti-sense RNA probes as indicated. (C) Segregation of ggt7lIM from line pIDM-A3. To segregate the causative mutation, pIDM-A3 F2 mutants with Dox-dependent fin regeneration defects were crossed with WT. The cross containing about 50% EGFP positive offspring were selected to produce F3 population. Left panel: Southern blot analysis of insertion copy numbers in the pool of embryos as indicated. Pool of EGFP positive F3: The F3 EGFP positive embryos were from the cross between the selected F2 fish and WT; Pool of EGFP positive F4: The F4 EGFP positive embryos were from the cross between one of F3 adult fish and WT. Southern blot was performed as described in Supplementary Figure 3. Right panel: PCR analysis to identify the insertion site. A primer from ggt7l exon 5 was used with pIDM specific primer to amplify the insertion site. The DNA lysed from caudal fin of individual F3 fish was used to do PCR analysis. The DNA from EGFP positive F1 embryo pool was used as the positive control. The DNA from EGFP negative F3 fish was used as the negative control. (D) Segregation of cry61IM from line pIDM-E7. To segregate the causative mutation, pIDM-E7 F2 mutants with Dox-dependent fin regeneration defects were crossed with WT. The cross containing about 50% EGFP positive offspring were selected to set up F3 population. Left panel: Southern blot analysis of insertion copy numbers in the pool of embryos as indicated. Pool of EGFP positive F3: The F3 EGFP positive embryos were from the cross between the selected F2 fish and WT; Pool of EGFP positive F4: The F4 EGFP positive embryos were from the cross between one of F3 adult fish and WT. Southern blot was performed as described in Supplementary Figure 3. Right panel: PCR analysis to identify the insertion site. A primer from cry61 intron 1 was used with pIDM specific primer to amplify the insertion site. The DNA lysed from caudal fin of individual F3 fish was used to do PCR analysis. The DNA from EGFP positive F1 embryo pool was used as the positive control. The DNA from EGFP negative F3 fish was used as the negative control. |

