
|
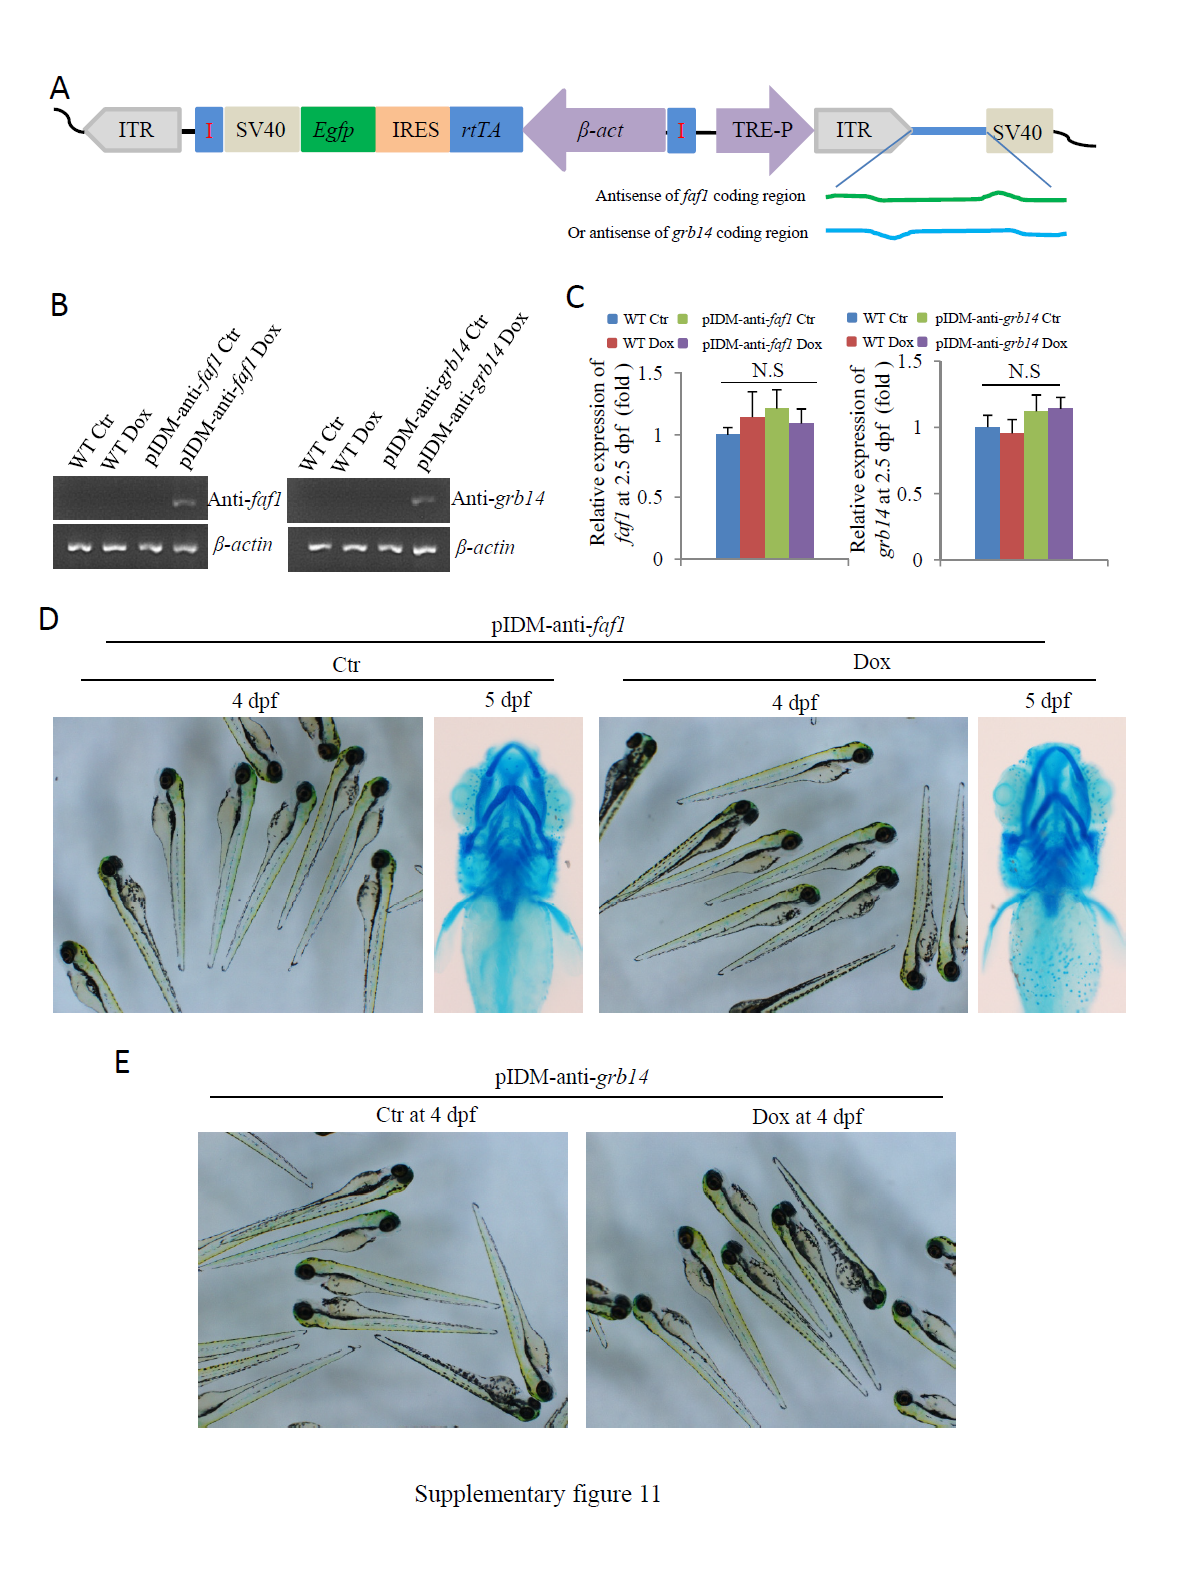
Fig. S11
Dox treated transgenic embryos from either pIDM-anti-faf1 or pIDM-anti-grb14 developed normally and did not display similar phenotypes as Dox treated mutant embryos from either pIDM-A11 or pIDM-E10 did. (A) Diagram of pIDM-anti-faf1 and pIDM-anti-grb14 vectors. The abbreviations for each item in the vectors are the same as those in the pIDM:HA-DsRed construct (Figure 1B), except where HA-DsRed was replaced with either the anti-sense of faf1 or grb14 coding region cDNA. (B) Induction of the anti-sense transcript of faf1 or grb14 in the pIDM-anti-faf1 or pIDM-anti-grb14 embryos treated with Dox was analyzed with qRT-PCR using the primer pairs anti-faf1-qRT-For and –Rev or anti-grb14-qRT-For and -Rev. (C) The relative expression level of the faf1 or grb14 transcripts was analyzed with specific primers faf1-F and faf1-R or grb14-F and grb14-R in different samples as indicated at 2.5 dpf . β-actin was used to normalize the total RNA. (D) The pIDM-anti-faf1 embryos were treated with Dox at 12 hpf. The pictures were taken at 4 dpf (1st and 3rd panels). The embryos treated and untreated with Dox (Ctr) were sampled at 5 dpf and subsequently subjected to alcian-blue-staining for pharyngeal cartilage (2nd and 4th panels). (E) The pIDM-anti-grb14 embryos were treated with Dox at 12 hpf. The pictures were taken at 4 dpf.