
|
Fig. S6
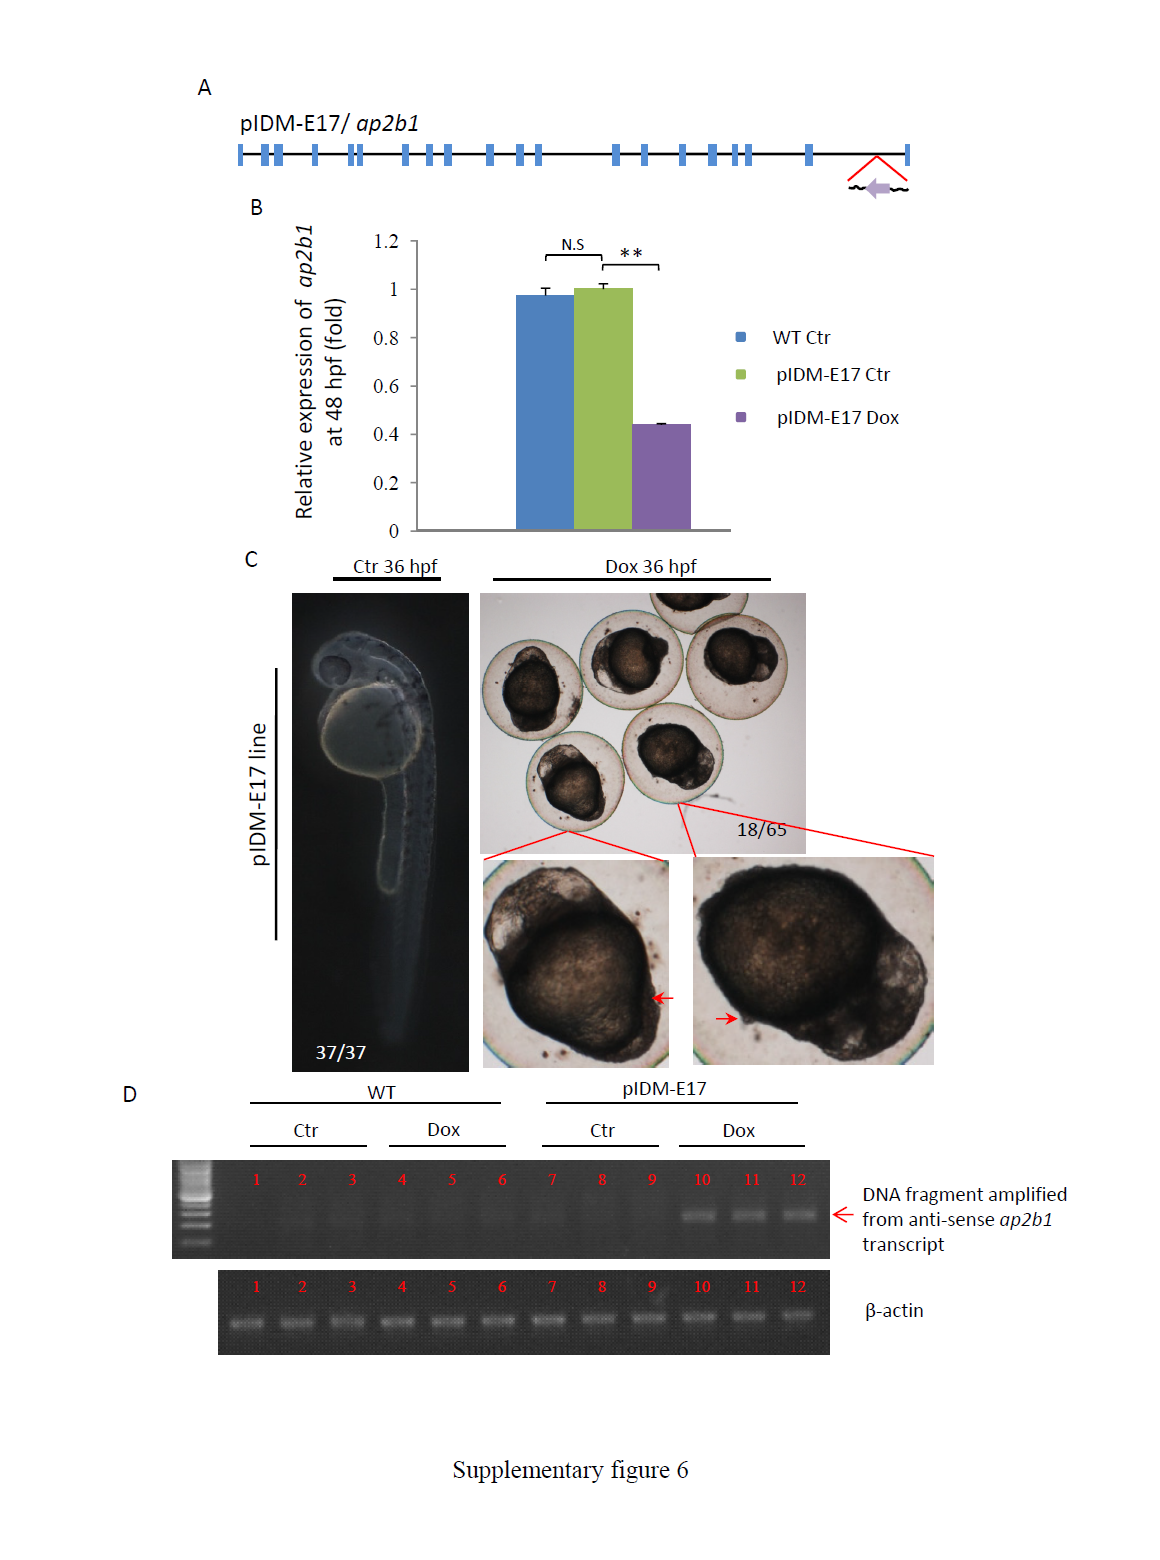
Supplementary information for line pIDM-E17. (A) Diagram showing the position and orientation of pIDM in the ap2b1 genomic DNA. (B) The relative expression level of the ap2b1 transcripts was analyzed with specific primers ap2b1-F and ap2b1-R at 48 hpf. β-actin was used to normalize the total RNA. (C) Pictures of pIDM-E17 embryos treated or untreated with Dox at 36 hpf. Red arrow, extruded-yolk. Number, type of represented embryos/total embryos in F2 population. (D) The induction of the anti-sense transcript of ap2b1 in the pIDM-E17 embryos treated with Dox was analyzed with qRT-PCR using primer pairs ap2b1-intron21-F and ap2b1-intron21-R.