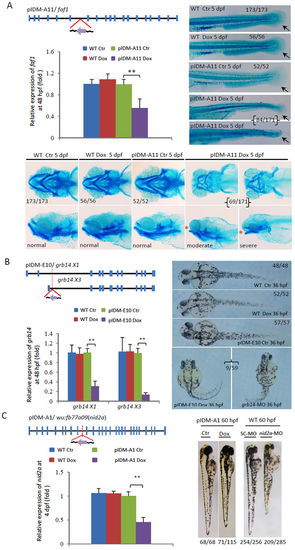
Dox-dependent down-regulation of genes in three example mutants causes abnormal embryonic development. (A) Line pIDM-A11. pIDM-A, a β-act promoter was used to drive rtTA and Egfp genes. Diagram showing the position and orientation of pIDM in the faf1 genomic DNA. Black line, intron or intergenic DNA; Blue vertical bar, exon; Purple arrow, direction of Tet-on promoter; Red lines, position of the insertion. Total RNA was extracted at 48 hpf. The relative expression of the faf1 transcript was analyzed with qRT-PCR. β-actin was used to normalize the total RNA. The embryos treated and untreated with Dox (Ctr) were sampled at 5 dpf and subsequently subjected to alcian-blue-staining for fin (Top right panel) and pharyngeal cartilage (Bottom panel). Black arrow, position of caudal fin; Red star, ‘open-mouse’ phenotype. (B) Line pIDM-E10. pIDM-E, an elf1a promoter was used to drive rtTA and Egfp genes. Diagram of the position and orientation of pIDM in the grb14 genomic DNA (including two isoforms grb14X1 and X3). The relative expression level of grb14X1 and X3 transcripts was analyzed by qRT-PCR with specific primers at 48 hpf. Pictures of WT and mutant embryos with different treatments at 36 hpf as indicated, noting that grb14-MO morphants had similar defects as that in pIDM-E10 transgenic embryos upon Dox induction. (C) Line pIDM-A1. Diagram of the position and orientation of pIDM in the wu:fb77a09(nid2a) genomic DNA. The relative expression level of the nid2a transcript was analyzed at 4 dpf. Pictures of WT and mutant embryos with differing treatments at 60 hpf as indicated. In A, B and C, representative embryos are shown, the number of embryos showing the displayed phenotype versus total embryos examined are provided in the corresponding panels. All statistically significant differences between samples were assessed with the independent-samples T-test (*P < 0.05, **P < 0.01, ***P < 0.001).
|
