
|
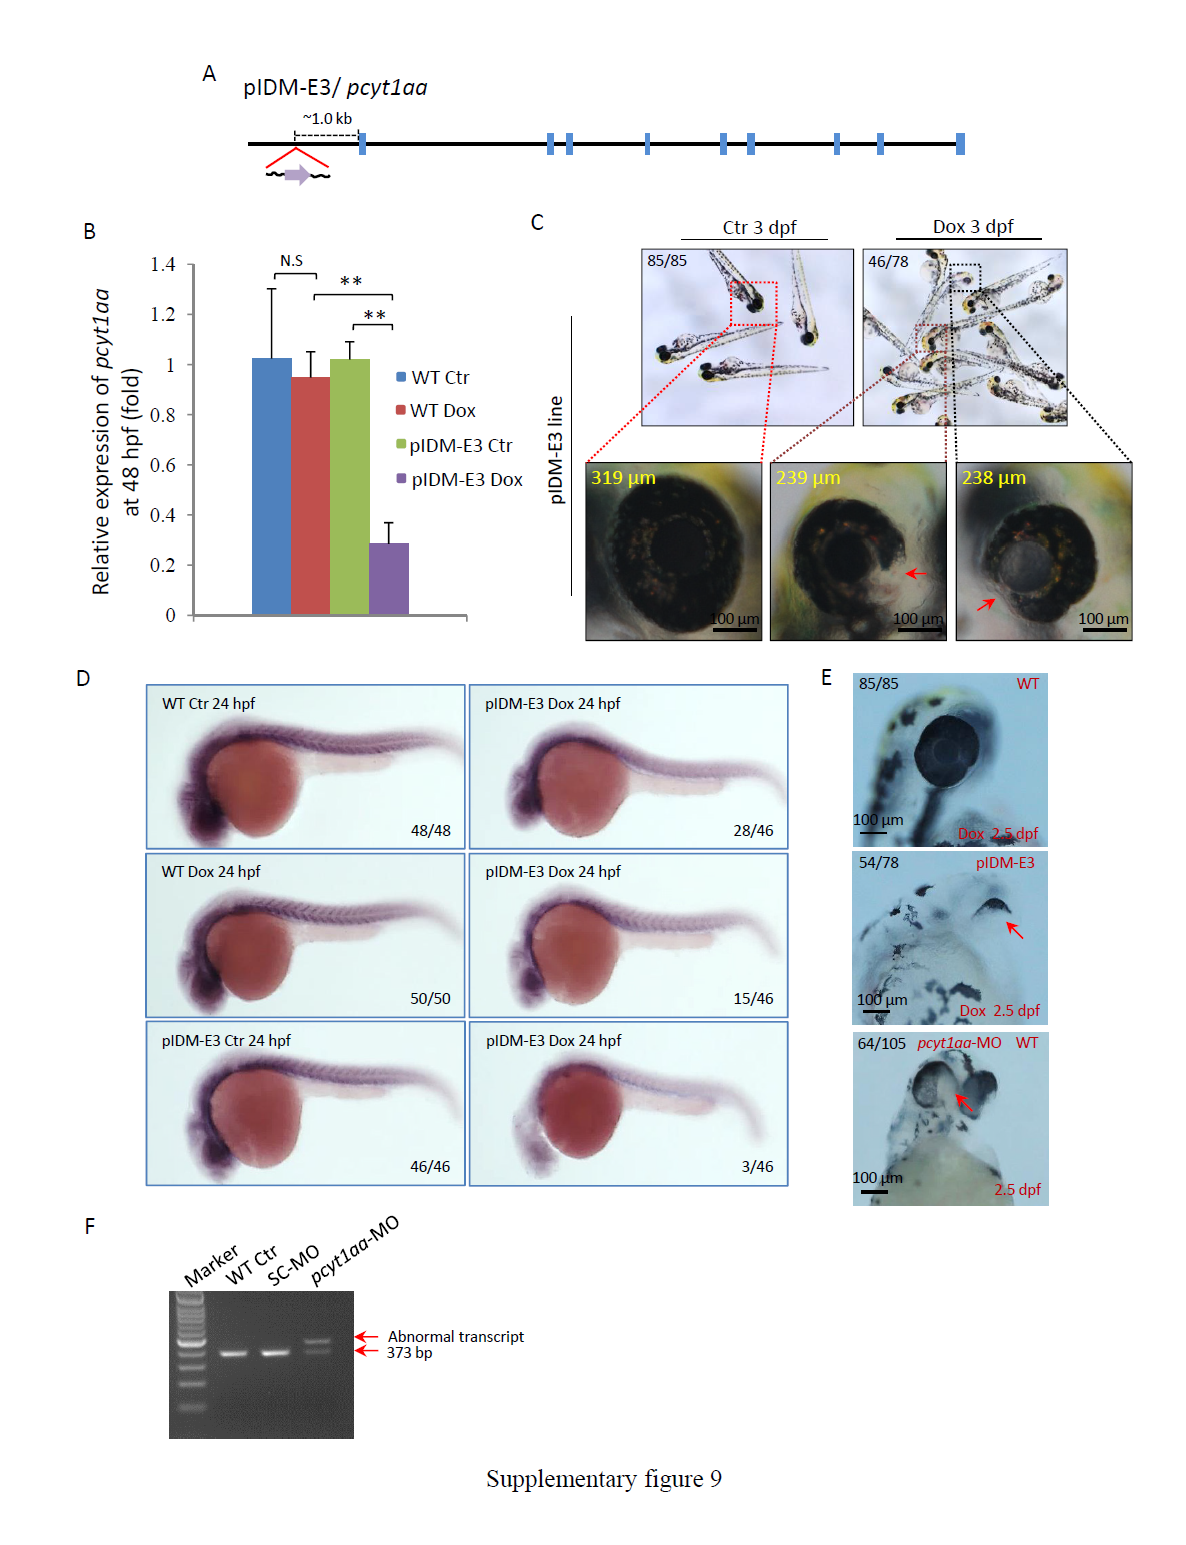
Fig. S9
Supplementary information for line pIDM-E3. (A) Diagram showing the position and orientation of pIDM in the pcyt1aa genomic DNA. (B) The relative expression levels of the pcyt1aa transcript were analyzed with specific primers pcyt1aa-F and pcyt1aa-R at 48 hpf. β-actin was used to normalize the total RNA. (C) Pictures of pIDM-E3 embryos treated or untreated with Dox at 3 dpf. The diameter of the eyes in the enlarged pictures is shown as a yellow number. Red arrow, less pigmentation in eyes. (D) Reduction of the pcyt1aa expression in the pIDM-E3 embryos treated with Dox. The treated embryos were sampled at 24 hpf and subjected to WISH. Anti-sense RNA of pcy1aa was used to perform WISH. (E) Pictures of WT and pIDM-E3 embryos with different treatments at 2.5 dpf as indicated. pcyt1aa-MO was designed to specifically block pcyt1aa transcript splicing and was injected into WT embryos at the one-cell stage. Red arrow, less pigmentation in eyes. (F) RT-PCR analysis showed that pcyt1aa-MO had created an aberrant transcript of pcyt1aa, due to abnormal splicing. WT embryos and WT embryos injected with SC-MO were used as the control.
Numbers in C-E, type of represented embryos/total embryos in F2 population.