
- Title
-
microRNA-206 modulates an Rtn4a/Cxcr4a/Thbs3a axis in newly forming somites to maintain and stabilize the somite boundary formation of zebrafish embryos.
- Authors
- Lin, C.Y., He, J.Y., Zeng, C.W., Loo, M.R., Chang, W.Y., Zhang, P.H., Tsai, H.J.
- Source
- Full text @ Open Biol.
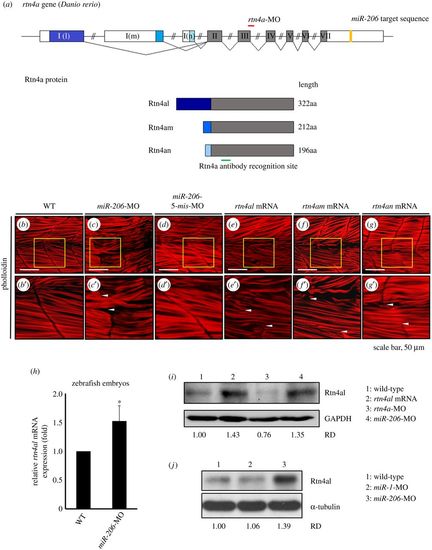
Knockdown of endogenous miR-206 increases the level of Rtn4al protein, causing abnormal transverse actin filaments across the somite boundary. (a) The genomic structure of three isoforms of rtn4a genes. Locations of the rtn4a-MO binding sequence (red line), miR-206 binding site at the 3′UTR of rtn4a mRNA (yellow box), and recognized region of antibody against Rtn4a protein (green line) were indicated. (b) WT, (c) miR-206-MO-injected, (d) miR-206-5-mis-MO-injected, (e) rtn4al-mRNA-injected, (f) rtn4am-mRNA-injected, and (g) rtn4an-mRNA-injected embryos developed at 48 hpf were immunostained with fluorescent phalloidin to label F-actin. Panels (b′–g′) were the enlarged views of corresponding panels (b–g). The area between the two arrowheads indicates the abnormal transverse actin filaments across the somite boundary. (h) The relative amounts of rtn4al mRNA between WT deheaded embryos and miR-206-MO-injected deheaded embryos at 20 hpf were quantified by qPCR when that of WT was normalized as 1. One hundred embryos were used each time, and experiments were performed in triplicate (n = 3). (i) Western blot analysis of Rtn4al (35 kD) among proteins extracted from deheaded embryos at 20 hpf: in WT (lane 1), rtn4al-mRNA-injected embryos (lane 2), rtn4a-MO-injected embryos (lane 3) and miR-206-MO-injected embryos (lane 4). (j) Western blot analysis of Rtn4al among proteins extracted from deheaded embryos at 20 hpf: in WT (lane 1), miR-1-MO-injected embryos (lane 2), and miR-206-MO-injected embryos (lane 3). Student's t-test was used for statistical analysis. Asterisk indicates significant difference at *p < 0.05. RD: Relative density. GAPDH and tubulin served as internal controls. EXPRESSION / LABELING:
PHENOTYPE:
|
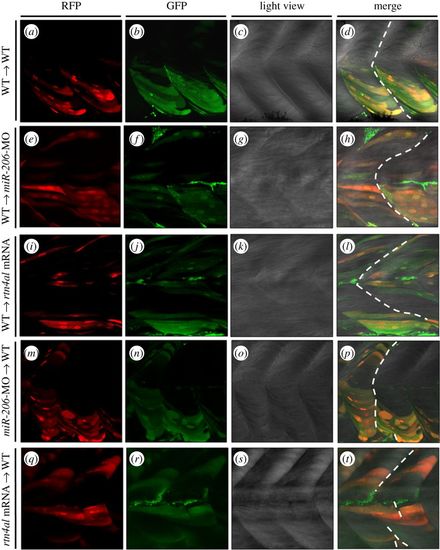
Transplantation of cells derived from either miR-206-MO- or rtn4al-mRNA-injected embryos causes recipient embryos to generate somite boundary defects. (a–d) After Dextran was injected into Tg(α-actin:RFP) embryos at the one-cell stage, cells were taken from donor embryos at 4 hpf and transplanted into WT embryos at 4.7 hpf. Embryonic somite boundary development was observed when embryos were 48 hpf. (a) Differentiated muscle cells among the transplanted cells were marked by RFP. (b) All transplanted cells were marked with green fluorescent signal. (c) Somite morphology was observed under microscopic light field. (d) Somite boundary was normally formed. (e–h) Transplanted cells from Dextran-injected Tg(α-actin:RFP) embryos to miR-206-MO-injected embryos. (i–l) Transplanted cells from Dextran-injected Tg(α-actin:RFP) embryos to rtn4al-mRNA-injected embryos. (m–p) Transplanted cells from Dextran- and miR-206-MO-injected Tg(α-actin:RFP) embryos to WT embryos. (q–t) Transplanted cells from Dextran- and rtn4al-mRNA-injected Tg(α-actin:RFP) embryos to WT embryos. Broken line indicates formation of the somite boundary. |
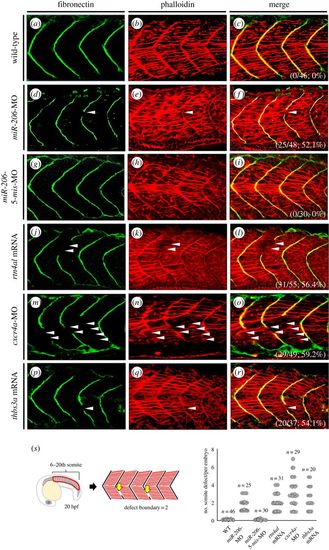
Somite boundary defect occurred in either cxcr4a-knockdown or thbs3a-overexpression zebrafish embryos. (a–c) None treated control WT embryos, (d–f) miR-206-knockdown embryos, (g–i) miR-206-5-mis-MO-injected embryos (served as control), (j–l) rtn4al-mRNA-overexpressed embryos, (m–o) cxcr4a-knockdown embryos, and (p–r) thbs3a-mRNA-overexpressed embryos were examined. Immunofluorescent staining was performed on the embryos at 20 hpf. (a,d,g,j,m,p) Fibronectin was labelled with green fluorescent signal to detect somite boundary. (b,e,h,k,n,q) Phalloidin was labelled with red fluorescent signal to detect F-actin. (c,f,i,l,o,r) Merge of the two signals. Places where the somite boundary was absent were marked by white arrowheads. The numbers shown on the lower-right corner are the percentages of defective somite boundary occurrence averaged from three independent experiments. (s) Quantification of the number of defective boundaries per embryo at the 6th to 20th pairs of somites on both sides of the trunk at 20 hpf. PHENOTYPE:
|
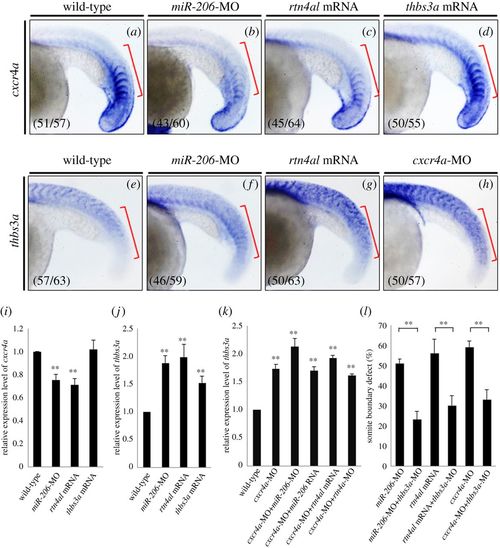
Injection of cxcr4a can repress thbs3a expression in zebrafish somites, but thbs3a cannot repress cxcr4a. Using WISH to detect the spatial expression patterns of (a–d) cxcr4a and (e–h) thbs3a in somites of zebrafish embryos at 20 hpf. (a,e) WT embryos; (b,f) knockdown of miR-206; (c,g) overexpression of Rtn4al; (d) overexpression of Thbs3a; and (h) knockdown of Cxcr4a. The cxcr4a expression level was reduced in the somites of (b) miR-206-MO-injected embryos and (c) rtn4al-mRNA-injected embryos, while (d) cxcr4a expression was not affected by overexpression of Thbs3a. On the other hand, thbs3a expression level was increased in the somites of (f) miR-206-MO-injected embryos and (g) rtn4al mRNA-injected embryos, while (h) thbs3a expression was also increased in cxcr4a-MO-injected embryos. Data shown at the lower-left corner are the number of phenotypes out of the examined embryos. (i,j) The expression levels of cxcr4a and thbs3a in each group were quantified. (k) Using q-PCR to quantify the levels of thbs3a mRNA expression in WT and embryos injected either cxcr4a-MO alone or cxcr4a-MO combined with miR-206-MO, miR-206 RNA, rtn4al-MO or rtn4al mRNA. One hundred embryos were studied each time, and three independent experiments were performed (n = 3). (l) miR-206-MO-, rtn4al-mRNA-, or cxcr4a-MO-injected embryos together with knockdown of thbs3a all reduced the percentages of defective boundary. Numbers shown at the lower-left corner were the numbers of phenotypes out of the examined embryos. Student's t-test was used for statistical analysis. Asterisks indicate the significant difference level at **p < 0.01. EXPRESSION / LABELING:
PHENOTYPE:
|
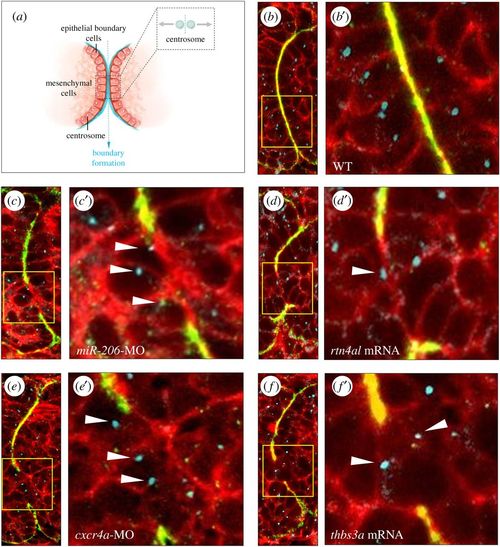
Change of expression levels of miR-206, Rtn4al, Cxcr4a or Thbs3a fails to epithelialize somites in zebrafish embryos. (a) A diagram depicts that centrosomes of epithelial cells at the somite boundary are localized apically when epithelial cells undergo MET. (b) WT embryos at 20 hpf; (c) knockdown of miR-206, (d) overexpression of rtn4al, (e) knockdown of cxcr4a and (f) overexpression of thbs3a. Fibronectin labelled with green fluorescent signal was used to mark the somite boundary; Phalloidin labelled with red fluorescent signal was used to mark F-actin, while γ-tubulin labelled with blue fluorescent signal was used to mark centrosomes. (b–f) Three fluorescent signals were merged; (b′–f′) were amplified from the corresponding panels (b–f). White arrowheads indicate centrosomes not localized apically in the epithelial cells of the defective somite boundary. PHENOTYPE:
|
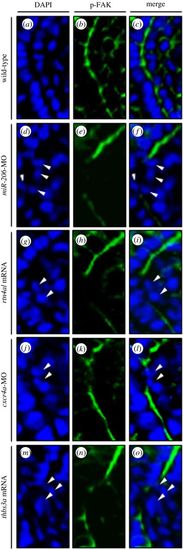
Change of the expression levels of miR-206, Rtn4al, Cxcr4a and Thbs3a resulted in the failure of p-FAK to concentrate at the intersomitic boundary of defective boundary cells. (a–c) In the WT embryos at 20 hpf, p-FAK signal was concentrated at the position of the intersomitic boundary; (d–f) knockdown of miR-206, (g–i) overexpression of rtn4al, (j–l) knockdown of cxcr4a and (m–o) overexpression of thbs3a. DAPI labelled with blue fluorescent signal was used to mark the nucleus, while green fluorescent signal was used to label p-FAK. (c,f,i,l,o) Two fluorescent signals were merged. White arrowheads indicate that p-FAK did not concentrate at the intersomitic boundary of defective boundary cells. |