
|
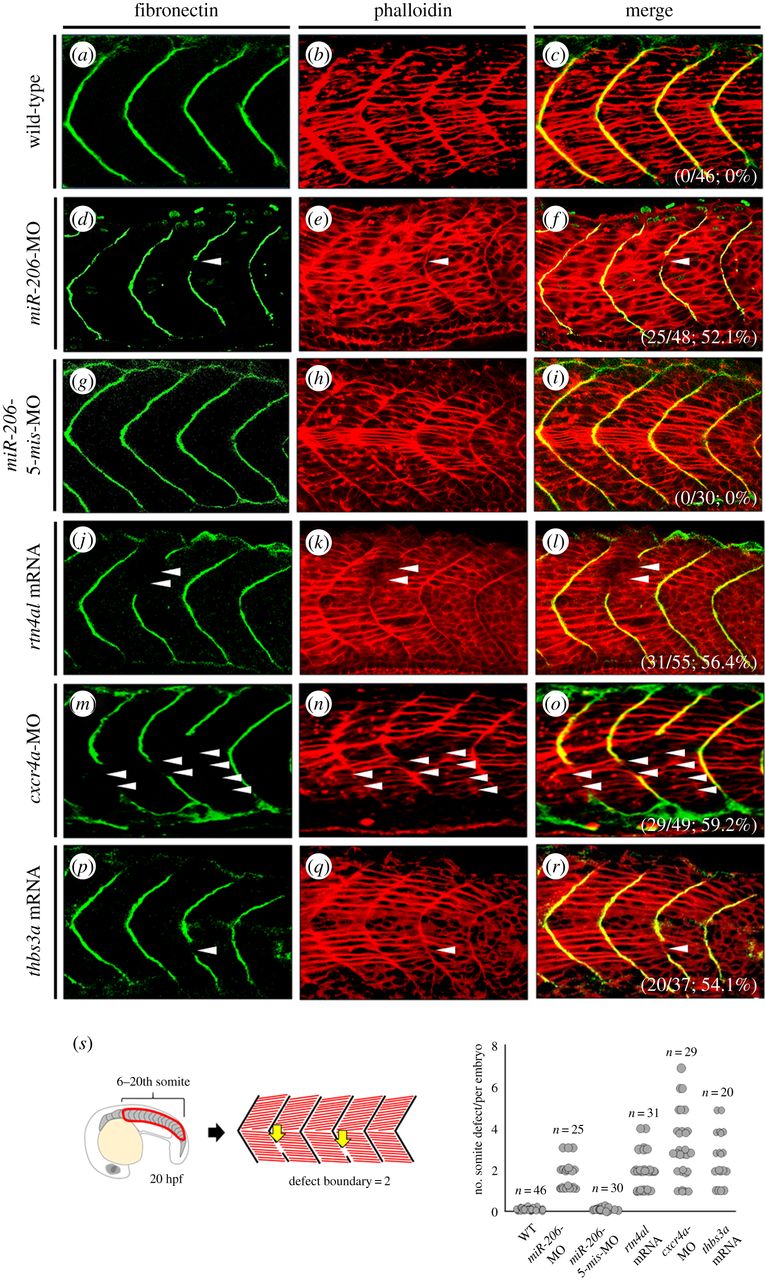
Fig. 4
Somite boundary defect occurred in either cxcr4a-knockdown or thbs3a-overexpression zebrafish embryos. (a–c) None treated control WT embryos, (d–f) miR-206-knockdown embryos, (g–i) miR-206-5-mis-MO-injected embryos (served as control), (j–l) rtn4al-mRNA-overexpressed embryos, (m–o) cxcr4a-knockdown embryos, and (p–r) thbs3a-mRNA-overexpressed embryos were examined. Immunofluorescent staining was performed on the embryos at 20 hpf. (a,d,g,j,m,p) Fibronectin was labelled with green fluorescent signal to detect somite boundary. (b,e,h,k,n,q) Phalloidin was labelled with red fluorescent signal to detect F-actin. (c,f,i,l,o,r) Merge of the two signals. Places where the somite boundary was absent were marked by white arrowheads. The numbers shown on the lower-right corner are the percentages of defective somite boundary occurrence averaged from three independent experiments. (s) Quantification of the number of defective boundaries per embryo at the 6th to 20th pairs of somites on both sides of the trunk at 20 hpf.