
|
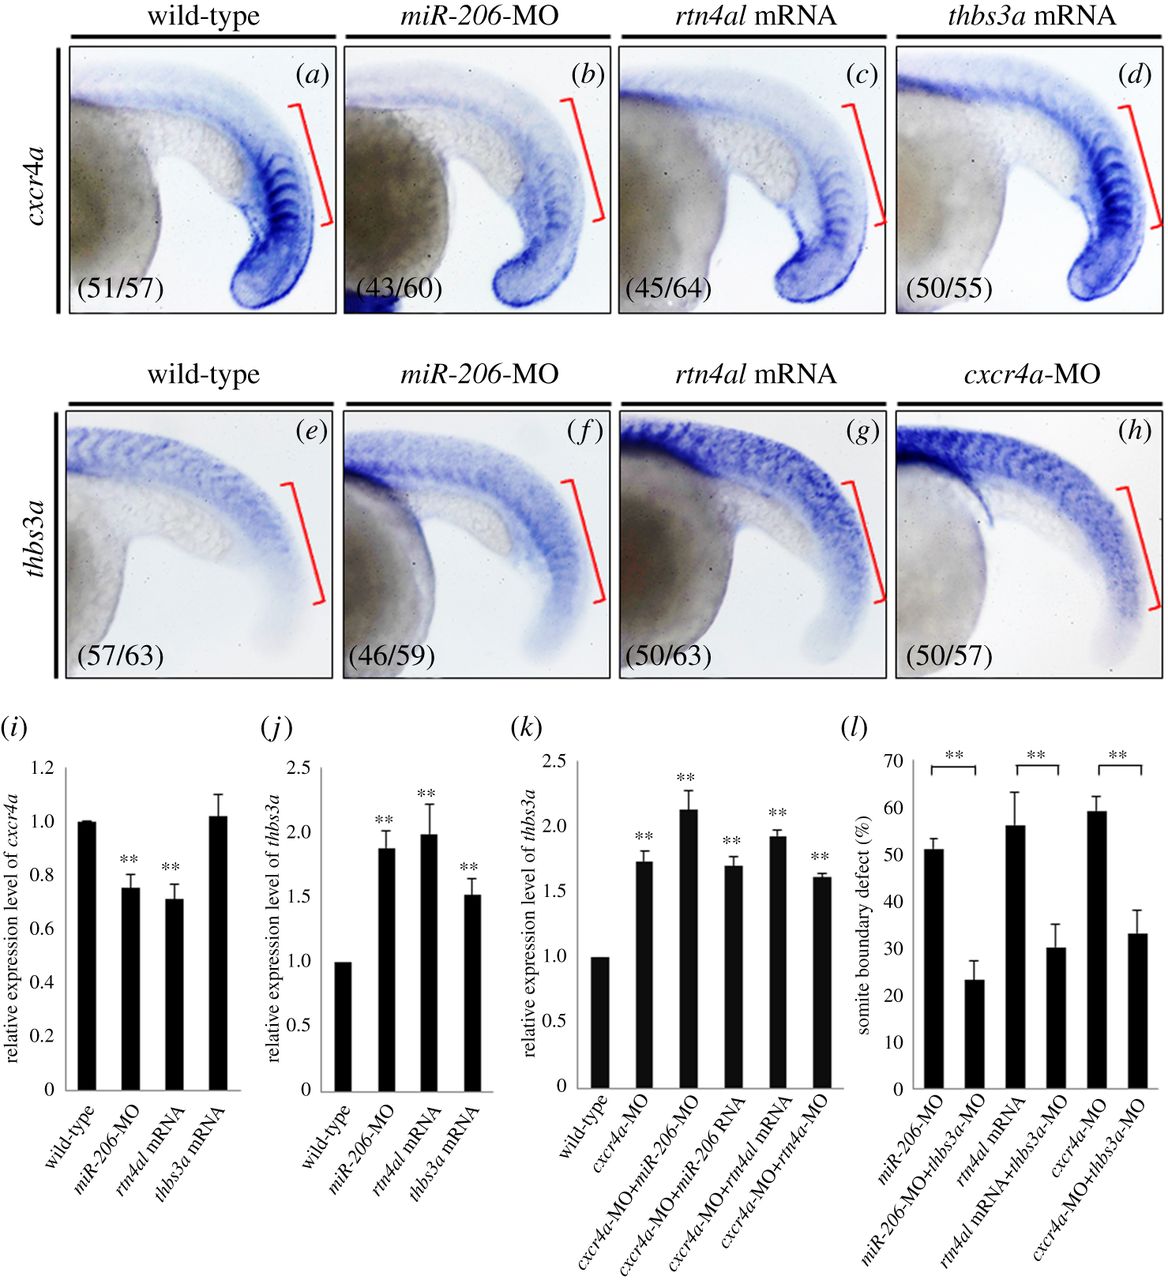
Fig. 5
Injection of cxcr4a can repress thbs3a expression in zebrafish somites, but thbs3a cannot repress cxcr4a. Using WISH to detect the spatial expression patterns of (a–d) cxcr4a and (e–h) thbs3a in somites of zebrafish embryos at 20 hpf. (a,e) WT embryos; (b,f) knockdown of miR-206; (c,g) overexpression of Rtn4al; (d) overexpression of Thbs3a; and (h) knockdown of Cxcr4a. The cxcr4a expression level was reduced in the somites of (b) miR-206-MO-injected embryos and (c) rtn4al-mRNA-injected embryos, while (d) cxcr4a expression was not affected by overexpression of Thbs3a. On the other hand, thbs3a expression level was increased in the somites of (f) miR-206-MO-injected embryos and (g) rtn4al mRNA-injected embryos, while (h) thbs3a expression was also increased in cxcr4a-MO-injected embryos. Data shown at the lower-left corner are the number of phenotypes out of the examined embryos. (i,j) The expression levels of cxcr4a and thbs3a in each group were quantified. (k) Using q-PCR to quantify the levels of thbs3a mRNA expression in WT and embryos injected either cxcr4a-MO alone or cxcr4a-MO combined with miR-206-MO, miR-206 RNA, rtn4al-MO or rtn4al mRNA. One hundred embryos were studied each time, and three independent experiments were performed (n = 3). (l) miR-206-MO-, rtn4al-mRNA-, or cxcr4a-MO-injected embryos together with knockdown of thbs3a all reduced the percentages of defective boundary. Numbers shown at the lower-left corner were the numbers of phenotypes out of the examined embryos. Student's t-test was used for statistical analysis. Asterisks indicate the significant difference level at **p < 0.01.