
Fig. 6
- ID
- ZDB-IMAGE-170815-37
- Publication
- Lin et al., 2017 - microRNA-206 modulates an Rtn4a/Cxcr4a/Thbs3a axis in newly forming somites to maintain and stabilize the somite boundary formation of zebrafish embryos.
- All Figures
- Figures for Lin et al., 2017
|
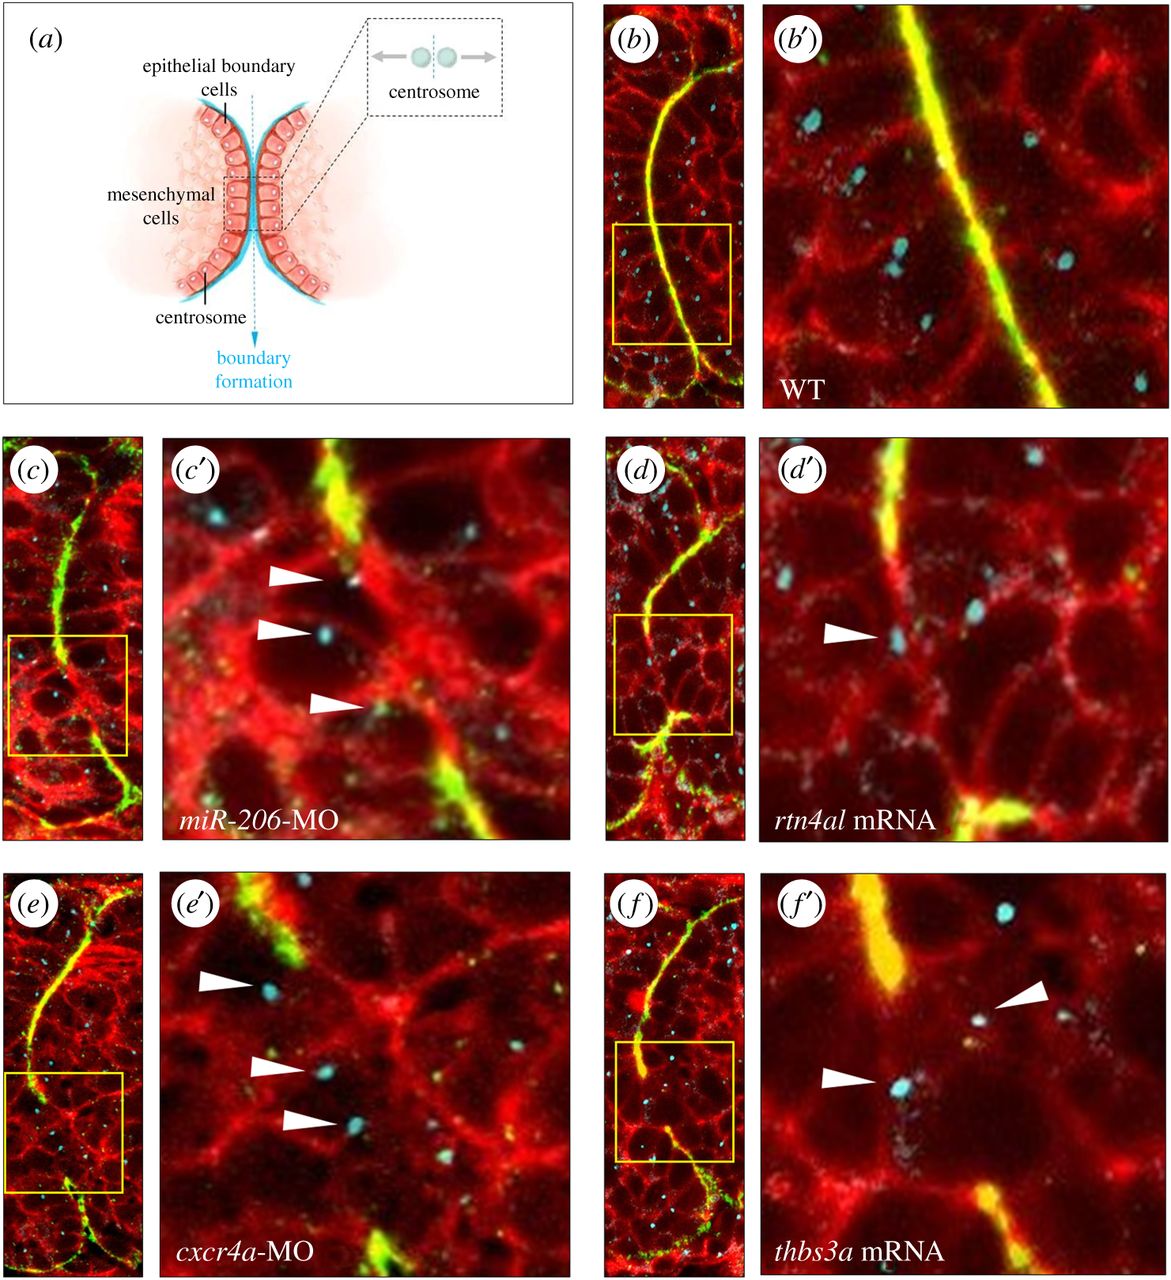
Fig. 6
Change of expression levels of miR-206, Rtn4al, Cxcr4a or Thbs3a fails to epithelialize somites in zebrafish embryos. (a) A diagram depicts that centrosomes of epithelial cells at the somite boundary are localized apically when epithelial cells undergo MET. (b) WT embryos at 20 hpf; (c) knockdown of miR-206, (d) overexpression of rtn4al, (e) knockdown of cxcr4a and (f) overexpression of thbs3a. Fibronectin labelled with green fluorescent signal was used to mark the somite boundary; Phalloidin labelled with red fluorescent signal was used to mark F-actin, while γ-tubulin labelled with blue fluorescent signal was used to mark centrosomes. (b–f) Three fluorescent signals were merged; (b′–f′) were amplified from the corresponding panels (b–f). White arrowheads indicate centrosomes not localized apically in the epithelial cells of the defective somite boundary.