
- Title
-
Stereotyped initiation of retinal waves by bipolar cells via presynaptic NMDA autoreceptors
- Authors
- Zhang, R.W., Li, X.Q., Kawakami, K., Du, J.L.
- Source
- Full text @ Nat. Commun.
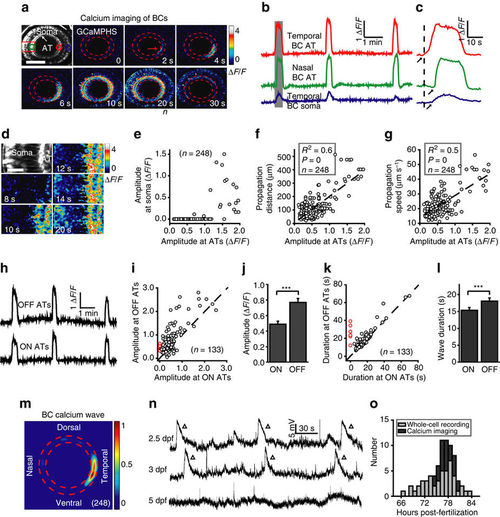
Developing bipolar cells display spontaneous wave activities in intact zebrafish larvae. (a) Pseudocolor time-lapse two-photon images showing a spontaneous calcium wave of bipolar cells (BCs) in a 3 d.p.f. Tg(Gal4-VP16xfz43,UAS:GCaMPHS) larva. Left top, fluorescence image showing the retinal structure and GCaMPHS expression in BCs. ‘AT’ and ‘Soma’ indicate the axon terminal and soma of BCs, respectively. Red arrow, initiation site of the wave. The area between the two red dashed circles is the location of the inner plexiform layer (IPL). Dorsal is up, and temporal is right. The same orientation is used for images in all of the following figures. Scale bar, 100 μm. (b) Calcium activities of three regions of interest in (a, colour circles). The shadowed area marks the period of images shown in a. (c) The first calcium wave in b at a higher time resolution. The arrows mark the onset of calcium activities. (d) Magnified time-lapse images of the boxed region in a showing the invasion of calcium waves from ATs to somata of BCs. Scale bar, 20 μm. (e–g) Plots of the peak amplitude of calcium waves at BC ATs in the initiation site versus their peak amplitude at BC somata (e) and propagation distance (f) and speed (g) at the IPL. The dotted lines represent linear regression. N=number of waves recorded. (h) Calcium activities of ON and OFF ATs at the initiation sites of the three waves in (b). (i,k) Plots of the peak amplitude (i) or duration (k) of BC calcium waves at ON ATs versus that at OFF ATs. The dotted lines represent the orthogonal. The red circles indicate six BC waves, which only initiated and propagated at OFF ATs in the nasal retina (Supplementary Fig. 2c,d). (j,l) Summary of data showing the peak amplitude (i) or duration (k) of calcium waves at BC ON or OFF ATs, respectively. (m) Superposition of the initiation site of 248 BC calcium waves from 23 larvae. Colour bar, normalized frequency of wave initiation. (n) Spontaneous electrical activities of BCs monitored with in vivo whole-cell recording in larvae at 2.5–5 days post-fertilization (d.p.f.). The triangles mark wave-like events of giant depolarizing potentials (GDPs). (o) Temporal distribution of BC wave occurrence during development. Whole-cell recording and calcium imaging data were obtained from 47 and 23 larvae, respectively. ***P<0.001; Statistical analysis was performed with ANOVA for the data in (f,g) and two-tailed paired Student’s t-test for the data in (j,l). Data are represented as mean±s.e.m. |
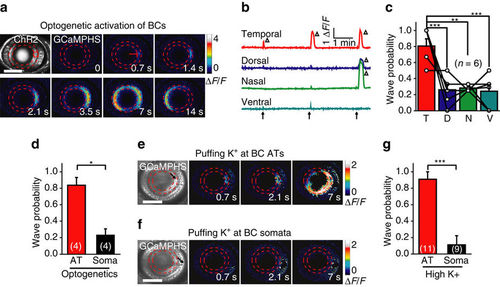
Axon terminals of BCs initiate retinal waves. (a) Time-lapse two-photon images showing a BC calcium wave evoked by 0.5 s optogenetic stimulation (started at time zero) at a cluster of ChR2-expressing BC ATs (red circle) in a transgenic Tg(Ribeye:ChR2-CFP,Gal4-VP16xfz43,UAS:GCaMPHS) larva. Left top, ChR2-CFP expression pattern in BCs. Red arrow, initiation site of the wave. Scale bar, 100 μm. (b) Repetitive optogenetic stimulation (arrow)-evoked calcium activities of BC ATs at four stimulation sites. The triangles mark the occurrence of calcium waves. (c) Occurrence probability of calcium waves evoked by optogenetics activation of BC ATs at different retinal regions. Data obtained from the same larva are connected by a line. The number in the brackets indicates the number of larvae examined. T, D, N and V indicate the temporal, dorsal, nasal and ventral retina, respectively. (d) Occurrence probability of calcium waves evoked by optogenetics stimulation at the AT or soma of BCs in the temporal retina. The number in the brackets represents the number of larvae examined. (e,f) BC calcium waves were evoked by local puffing of KCl (100 mM) at the ATs (e) but not the somata (f) in a 3-d.p.f. Tg(Gal4-VP16xfz43,UAS:GCaMP1.6) larva. The arrows in the bright-field images indicate the tip position of puffing micropipettes. The apparent increase in calcium signal around the puffing site (f) was due to puffing-induced displacement of BC somata. The puffing (0.1 s in duration) was performed at time zero. Scale bar, 100 μm. (g) Occurrence probability of calcium waves evoked by KCl puffing at the AT or soma of BCs in the temporal retina. *P<0.05, **P<0.01, ***P<0.001; one-way ANOVA for the data in (c), two-tailed paired Student’s t-test for the data in d, two-tailed unpaired Student’s t-test for the data in (g). Data are represented as mean±s.e.m. |
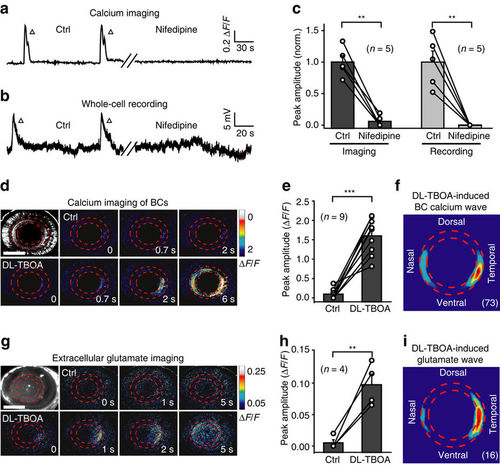
Glutamate release from BC ATs is important for BC wave occurrence. (a,b) Examples showing spontaneous calcium activities (a) and electrical activities (b) of BCs before (left) and 10 min after (right) bath application of nifedipine (50 μM). (c) Summary of data showing the effects of nifedipine on BC waves. Data obtained from the same larva are connected by a line. (d,e) Examples and summary of data showing that BC calcium waves were facilitated by bath application of DL-TBOA (50 μM) in a 3-d.p.f. Tg(Gal4-VP16xfz43,UAS:GCaMP1.6) larva. Scale bar, 100 μm. (f) Superposition of the initiation site of 73 BC calcium waves occurred under DL-TBOA application. (g) In vivo iGluSnFR-based extracellular glutamate imaging showing glutamate signals before (top) and 20 min after (bottom) bath application of DL-TBOA (50 μM) in a 3 d.p.f. larva expressing the glutamate biosensor iGluSnFR (left top). Scale bar, 100 μm. (h) Summary of glutamate imaging data. (i) Superposition of the initiation site of 16 glutamate waves under DL-TBOA application. **P<0.01, ***P<0.001; two-tailed paired Student’s t-test for the data in (c,e,h). Data are represented as mean±s.e.m. |
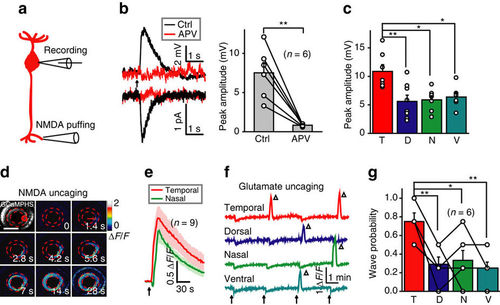
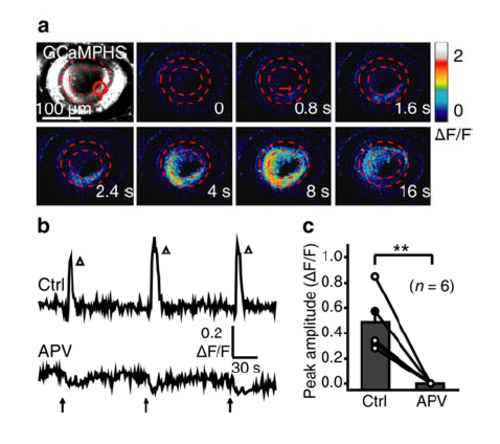
Activation of NMDARs at BC ATs is sufficient to initiate BC waves. (a) Schematic of simultaneous whole-cell patch-clamp recording at a BC soma and NMDA-containing solution puffing at a BC AT. (b) Left, NMDA puffing-evoked responses of BCs under current- (top) or voltage-clamp mode (bottom; holding potential, −60 mV) before (black) and after (red) application of APV (50 μM). The arrow marks the onset of puffing (0.1 s in duration). Right, summary of data. (c) Summary of NMDA-evoked responses of BCs in four different retinal regions. (d) BC calcium wave evoked by 0.5 s uncaging of NMDA (started at time zero) at a cluster of BC ATs in the temporal retina (red circle). Scale bar, 100 μm. (e) Mean calcium responses of temporal (uncaging site) and nasal BC ATs evoked by NMDA uncaging (arrow). The shadows represent error bars. (f) Repetitive glutamate uncaging (arrow)-evoked calcium activities of BC ATs at four uncaging sites. The triangles mark the occurrence of calcium waves. The slow reduction of calcium activities associated with each uncaging stimulus was due to laser-induced bleaching. (g) Occurrence probability of calcium waves evoked by glutamate uncaging at BC ATs in four different retinal regions. *P<0.05, **P<0.01; two-tailed paired Student’s t-test for the data in b, one-way ANOVA for the data in c and g. Data are represented as mean±s.e.m. |
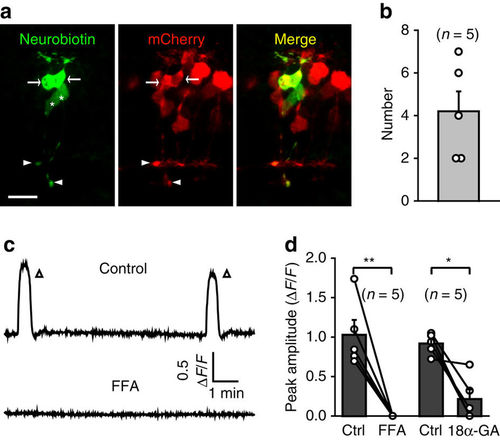
Gap junctions between BCs are necessary for the occurrence of BC waves. (a) Confocal images showing tracer coupling among nearby BCs. Neurobiotin was introduced into the BC soma of a 3-d.p.f. Tg(Gal4-VP16xfz43,UAS:nfsB-mCherry) larva through a recording micropipette. Due to the small size of zebrafish BCs, the soma of the recorded BC was pulled away by the removal of the micropipette. White arrows and arrowheads indicate the somata and ATs of coupled BCs. The white asterisks indicate two BCs with no expression of mCherry, because not all BCs express mCherry in Tg(Gal4-VP16xfz43,UAS:nfsB-mCherry) larvae. Scale bar, 10 μm. (b) Summary of data showing the number of coupled BCs. (c) Example showing spontaneous calcium activities of BCs before and 10 min after bath application of FFA (50 μM). (d) Summary of data showing the effects of FFA (50 μM) and 18α-GA (50 μM) on BC waves. Data obtained from the same larva are connected by a line. *P<0.05, **P<0.01; two-tailed paired Student’s t-test for the data in d. Data are represented as mean±s.e.m. |
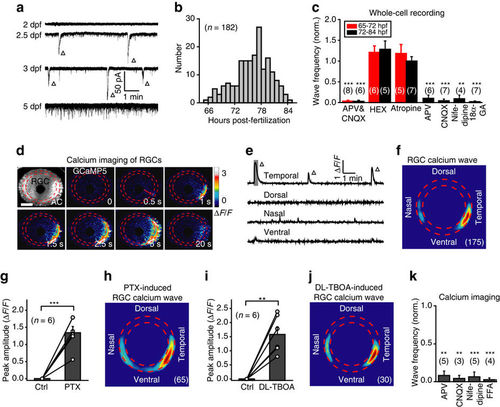
RGCs exhibit spontaneous retinal waves. (a) Spontaneous electrical activities of RGCs monitored with in vivo whole-cell recordings in 2- to 5-d.p.f. larvae. The triangles mark spontaneous wave-like GDPs. (b) Temporal distribution of the occurrence of spontaneous GDPs in RGCs (182 cells from 99 larvae). (c) Pharmacological properties of spontaneous GDPs in RGCs recorded during 65–72 h.p.f. (red) or 72–84 h.p.f. (black). The number in the brackets represents the number of RGCs recorded. APV&CNQX, 100 μM and 50 μM; HEX, 100 μM; atropine, 2 μM; APV, 100 μM; CNQX, 50 μM; nifedipine, 50 μM; 18α-GA, 50 μM. (d) Pseudocolor time-lapse two-photon images showing a spontaneous calcium wave of retinal ganglion cells (RGCs) in a 3 d.p.f. Tg(HuC:GCaMP5) larva. Left top, fluorescence image showing GCaMP5 expression in most of RGCs and some of amacrine cells (ACs). Red arrow, initiation site of the wave. Scale bar, 100 μm. (e) Calcium activities at four retinal regions. The shadowed area marks the period of images shown in d. (f) Superposition of the initiation site of 175 RGC calcium waves from 9 larvae. (g,i) Summary of the data showing the effect of picrotoxin (PTX, 200 μM) (f) or DL-TBOA (50 μM) (h) on RGC calcium waves. (h,j) Superposition of the initiation site of 65 RGC calcium waves induced by bath application of PTX (g) or 30 RGC waves by DL-TBOA (i). (k) Summary of the data showing the effects of APV (100 μM), CNQX (50 μM), nifedipine (50 μM) and FFA (50 μM) on the frequency of RGC calcium waves. The number in the brackets represents the number of retinae imaged. **P<0.01, ***P<0.001; two-tailed paired Student’s t-test for the data in (c,g,i,k). Data are represented as mean±s.e.m. |
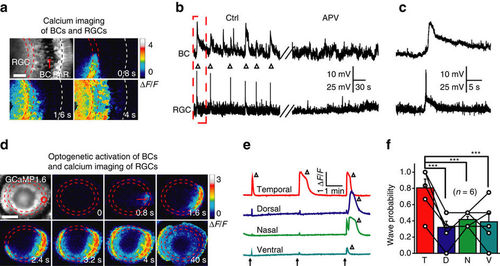
Glutamatergic waves can propagate from BCs to RGCs. (a) Calcium imaging of a 3 d.p.f. Tg(Gal4-VP16xfz43,Ath5:Gal4,UAS:GCaMP1.6) larva, showing that calcium waves initiated at the IPL can propagate to the soma of both BCs and RGCs. The region between the two red lines indicates the IPL and the white line marks the position of the outer plexiform layer (OPL). Scale bar, 20 μm. (b) In vivo dual whole-cell recording showing correlated spontaneous wave-like activities (triangles) between a BC and a RGC before (left) and after bath application of APV (right, 100 μM). (c) The first correlated events in b at a higher time resolution. (d) Time-lapse two-photon images showing a RGC calcium wave evoked by 0.5 s optogenetic stimulation (started at time zero) at a cluster of ChR2-expressing BC ATs (red circle) in a triple transgenic Tg(Ribeye:ChR2-CFP,Ath5:Gal4,UAS:GCaMP1.6) larva. Left top, GCaMP1.6 expression pattern in most of RGCs and some of ACs. Red arrow, initiation site of the wave. Scale bar, 100 μm. (e) RGC calcium activities evoked by repetitive optogenetic stimulation (arrows) of BC ATs at four different retinal regions. The triangles indicate the occurrence of RGC calcium waves. (f) Occurrence probability of RGC calcium waves evoked by optogenetics activation of BC ATs at four different retinal regions. ***P<0.001; one-way ANOVA for the data in f. Data are represented as mean±s.e.m. |
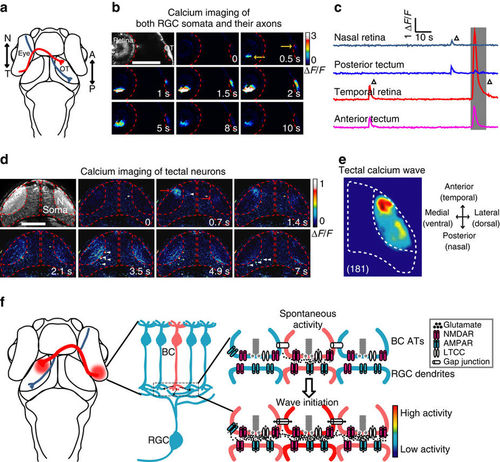
Retinal waves can propagate from RGCs to the optic tectum. (a) Schematic of the head of larval zebrafish and the projection of RGC axons from the eye to the optic tectum (OT). The red and blue lines indicate the axonal projections of RGCs at temporal (T) and nasal (N) retina into the anterior (A) and posterior (P) OT, respectively. (b) Pseudocolor time-lapse two-photon images showing correlated spontaneous calcium waves between RGC somata at the retina and their axon arborization at the OT of a 3 d.p.f. Tg(Ath5-gal4:UAS-GCaMP5) larva. Left top, fluorescence image showing GCaMP5 expression in RGCs and their axon terminals. Yellow arrows, initiation site of the waves in both retina and OT. Scale bar, 100 μm. (c) Calcium activities at two retinal and two tectal regions. The shadowed area marks the period of images shown in (b). (d) Pseudocolor time-lapse two-photon images showing spontaneous calcium waves in two OT hemispheres of a 3-d.p.f. Tg(HuC:GCaMP5) larva. Left top, fluorescence image showing GCaMP5 expression in the neuropil and soma layers of the OT. Red arrows, initiation site of the waves. White arrowheads, activated TNs during the propagation of the wave in the neuropil of the left OT. Scale bar, 100 μm. (e) Superposition of the initiation site of 181 calcium waves in the OT. Data were obtained from five larvae. (f) Schematic model showing the initiation of glutamatergic retinal waves. Spontaneously released glutamate from a BC (in pink, top) activates NMDARs at its own ATs. The activation of these presynaptic autoreceptors then depolarizes the membrane of ATs and consequently opens LTCCs, boosting glutamate release and leading to glutamate spillover within the IPL. Activation of NMDARs at neighbouring BC ATs by diffused glutamate and gap junctions between neighbouring BCs causes the lateral propagation of retinal waves at BC ATs along the IPL. On the other hand, glutamate also acts on postsynaptic AMPARs and NMDARs at the dendrites of RGCs, leading to the propagation of retinal waves from BCs to RGCs. |
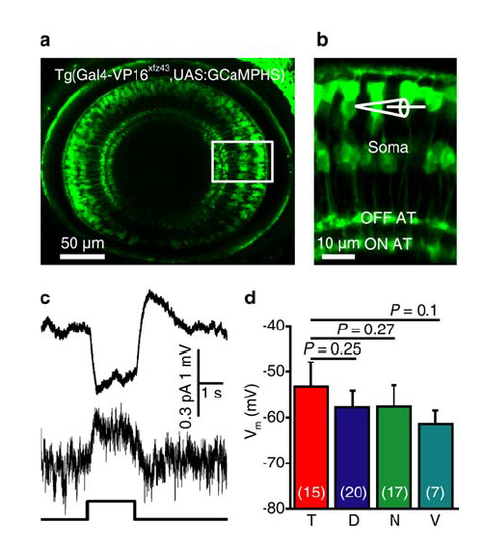
Expression of GCaMPHS in BCs and electrophysiological properties of BCs in zebrafish larvae. (a) Confocal image showing GCaMPHS expression in BCs of a 3-dpf Tg(Gal4-VP16xfz43,UAS:GCaMPHS) larva. (b) Enlarged view of the boxed region in (a), showing the GCaMPHS expression in the soma, axon and AT of BCs. In vivo whole-cell recording was performed on BC somata. (c) Light-evoked responses of an OFF subtype BC in response to a 2-s flash (bottom) under current- (top) or voltage-clamp mode (middle; holding potential, -60 mV). (d) Summary of data showing the resting membrane potentials (Vm) of BCs at four different retinal regions. The number in the brackets indicates the number of BCs examined. T, D, N and V indicate the temporal, dorsal, nasal and ventral retina, respectively. One-way ANOVA for the data in (d). Data are represented as mean ± s.e.m. |
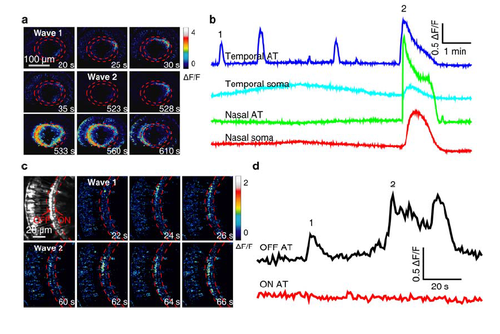
Calcium wave activities in the soma and AT of BCs. (a) Pseudocolor time-lapse images showing two BC calcium waves (1 and 2) in a 3-dpf Tg(Gal4-VP16xfz43,UAS:GCaMP1.6) larva. The wave 1 only propagated locally at BC ATs in the temporal-dorsal retina, while the wave 2 propagated globally to the entire IPL and evaded to BC somata. (b) Spontaneous BC calcium activities at four different retinal regions. BC ATs at the temporal retina displayed several wave-like events. The first and last waves are showed in (a). (c) Pseudocolor time-lapse images showing two BC calcium waves (1 and 2) in a 3-dpf Tg(Gal4-VP16xfz43,UAS:GCaMP1.6) larva. Both the two waves started and propagated locally at OFF ATs in the nasal retina. Left top, fluorescence image showing OFF and ON ATs which are located at the sublaminae a and b of the IPL, respectively. (d) Spontaneous BC calcium activities at OFF ATs, but not ON ATs in the nasal retina. Corresponding images are showed in (c). |
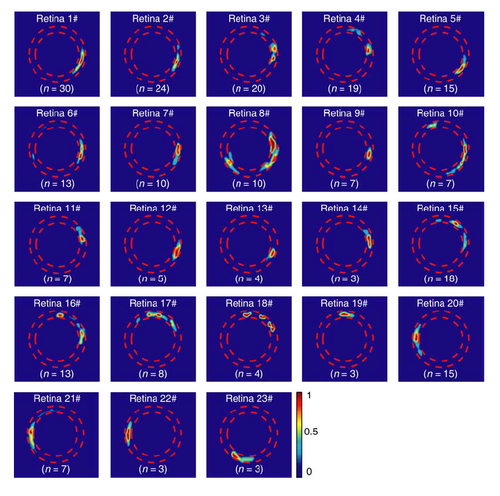
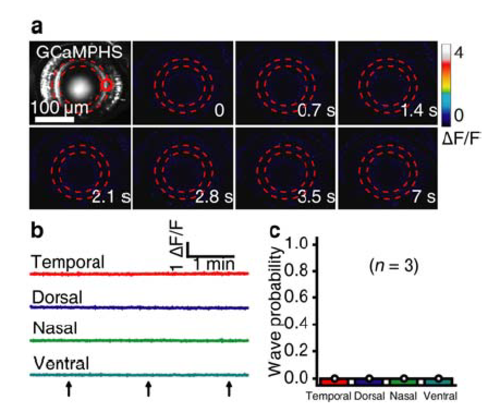
Stereotyped initiation sites of multiple BC calcium waves in individual retinae. The initiation site of all waves observed in individual retinae (n = 23) were superposed in heat maps. Waves in 14 retinae (#1 – #14) started mainly from BC ATs at the temporal retina, waves in 5 retinae (#15 – #19) from the dorsal region, waves in 3 retinae (#20 – #22) from the nasal region, and waves in 1 retina (#23) from the ventral region, though waves were initiated from 2 – 3 sites in some retinae (# 4, 8, 10, 15, 16, 17, 18). The number at bottom indicates the number of retinal waves occurred in each retina. |
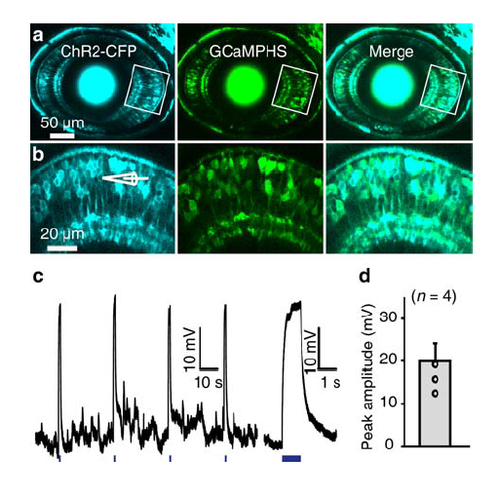
Co-expression of ChR2-CFP and GCaMPHS in BCs. (a) Confocal images showing the co-expression of ChR2-CFP and GCaMPHS in BCs of a 3-dpf Tg(Ribeye:ChR2-CFP,Gal4-VP16xfz43,UAS:GCaMPHS) larva. (b) Enlarged view of the boxed region in (a). (c) Depolarization of BCs in response to optogenetic stimulation (1 s in duration, 440 nm in wavelength, marked with blue lines at bottom). Right, the first depolarization response at a higher time resolution. (d) Summary of optogenetic activation-induced BC responses, which are much larger than light-evoked BC responses (see Supplementary Figure 1c). Data are represented as mean ± s.e.m. |
ChR2 expression is required for optogenetic activation. (a-c) Requirement of ChR2 expression for optogenetic activation. The same stimulation (started at time zero) on ChR2 non-expressing Tg(Gal4-VP16xfz43,UAS:GCaMPHS) larva did not evoke obvious calcium activity in BCs. Data are represented as mean ± s.e.m. |
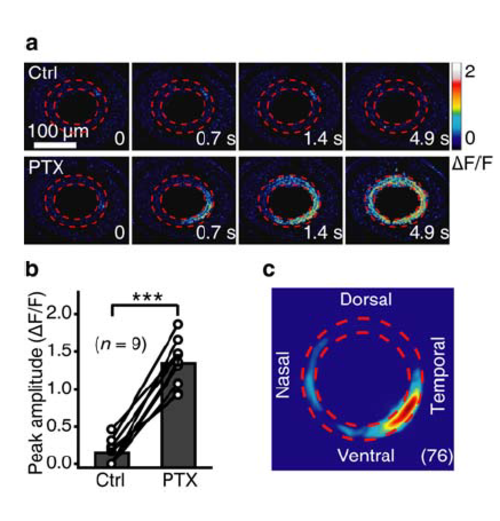
Blockade of inhibitory inputs facilitates the occurrence of BC waves. (a) Pseudocolor time-lapse images showing BC calcium activities before (top) and 20 min after bath application of picrotoxin (PTX, 200 μM) in a 3-dpf Tg(Gal4-VP16xfz43,UAS:GCaMP1.6) larva, which only exhibited local spontaneous calcium activities under control condition. (b) Summary of data obtained from 9 larvae. (c) Superposition of the initiation site of 76 BC calcium waves occurred under bath application of PTX. ***P < 0.001; two-tailed paired Student’s t-test. Data are represented as mean ± s.e.m. |
Glutamate uncaging at BC ATs evokes NMDAR-dependent BC calcium waves. (a) BC calcium wave evoked by 0.5-s uncaging of glutamate (started at time zero) at a cluster of BC ATs in the temporal-ventral retina (red circle) of a 3-dpf Tg(Gal4-VP16xfz43,UAS:GCaMP1.6) larva. Scale, 100 μm. (b and c) Example (b) and summary (c) showing the effect of APV application (100 μM) on glutamate uncaging-induced BC calcium waves. **P < 0.01; two-tailed paired Student’s t-test. Data are represented as mean ± s.e.m. |
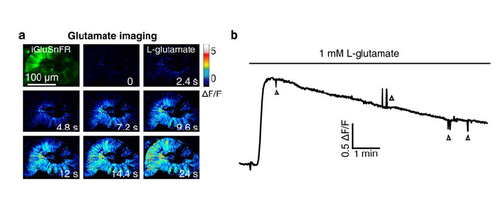
Application of L-glutamate induces an increase of glutamate signal in iGluSnFR-expressing retinal cells. (a) Pseudocolor time-lapse images showing the change of glutamate signal before and after bath application of 1-mM L-glutamate in the retina of a 44-hpf larva expressing the glutamate biosensor iGluSnFR (Left top). The lens of the retina was removed for the diffusion of L-glutamate into the retina. (b) Time course of glutamate signal changes in the retina (a). The downward and upward deflections (triangles) were due to the movement of the larva during imaging. |