
Fig. 5
- ID
- ZDB-FIG-170824-44
- Publication
- Zhang et al., 2016 - Stereotyped initiation of retinal waves by bipolar cells via presynaptic NMDA autoreceptors
- Other Figures
- All Figure Page
- Back to All Figure Page
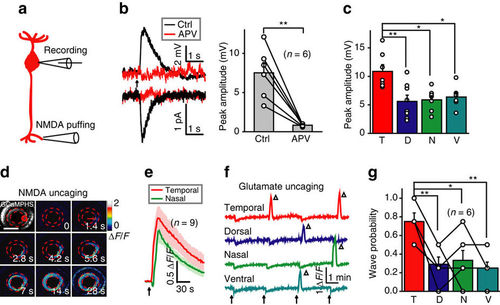
Activation of NMDARs at BC ATs is sufficient to initiate BC waves. (a) Schematic of simultaneous whole-cell patch-clamp recording at a BC soma and NMDA-containing solution puffing at a BC AT. (b) Left, NMDA puffing-evoked responses of BCs under current- (top) or voltage-clamp mode (bottom; holding potential, −60 mV) before (black) and after (red) application of APV (50 μM). The arrow marks the onset of puffing (0.1 s in duration). Right, summary of data. (c) Summary of NMDA-evoked responses of BCs in four different retinal regions. (d) BC calcium wave evoked by 0.5 s uncaging of NMDA (started at time zero) at a cluster of BC ATs in the temporal retina (red circle). Scale bar, 100 μm. (e) Mean calcium responses of temporal (uncaging site) and nasal BC ATs evoked by NMDA uncaging (arrow). The shadows represent error bars. (f) Repetitive glutamate uncaging (arrow)-evoked calcium activities of BC ATs at four uncaging sites. The triangles mark the occurrence of calcium waves. The slow reduction of calcium activities associated with each uncaging stimulus was due to laser-induced bleaching. (g) Occurrence probability of calcium waves evoked by glutamate uncaging at BC ATs in four different retinal regions. *P<0.05, **P<0.01; two-tailed paired Student’s t-test for the data in b, one-way ANOVA for the data in c and g. Data are represented as mean±s.e.m. |