
Fig. 8
- ID
- ZDB-FIG-170824-47
- Publication
- Zhang et al., 2016 - Stereotyped initiation of retinal waves by bipolar cells via presynaptic NMDA autoreceptors
- Other Figures
- All Figure Page
- Back to All Figure Page
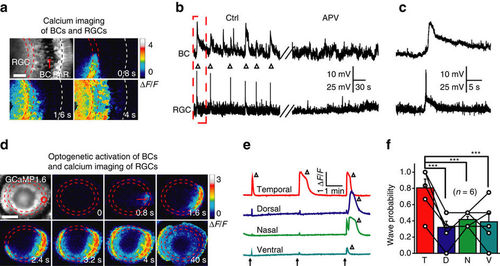
Glutamatergic waves can propagate from BCs to RGCs. (a) Calcium imaging of a 3 d.p.f. Tg(Gal4-VP16xfz43,Ath5:Gal4,UAS:GCaMP1.6) larva, showing that calcium waves initiated at the IPL can propagate to the soma of both BCs and RGCs. The region between the two red lines indicates the IPL and the white line marks the position of the outer plexiform layer (OPL). Scale bar, 20 μm. (b) In vivo dual whole-cell recording showing correlated spontaneous wave-like activities (triangles) between a BC and a RGC before (left) and after bath application of APV (right, 100 μM). (c) The first correlated events in b at a higher time resolution. (d) Time-lapse two-photon images showing a RGC calcium wave evoked by 0.5 s optogenetic stimulation (started at time zero) at a cluster of ChR2-expressing BC ATs (red circle) in a triple transgenic Tg(Ribeye:ChR2-CFP,Ath5:Gal4,UAS:GCaMP1.6) larva. Left top, GCaMP1.6 expression pattern in most of RGCs and some of ACs. Red arrow, initiation site of the wave. Scale bar, 100 μm. (e) RGC calcium activities evoked by repetitive optogenetic stimulation (arrows) of BC ATs at four different retinal regions. The triangles indicate the occurrence of RGC calcium waves. (f) Occurrence probability of RGC calcium waves evoked by optogenetics activation of BC ATs at four different retinal regions. ***P<0.001; one-way ANOVA for the data in f. Data are represented as mean±s.e.m. |