
Fig. 3
- ID
- ZDB-FIG-170824-43
- Publication
- Zhang et al., 2016 - Stereotyped initiation of retinal waves by bipolar cells via presynaptic NMDA autoreceptors
- Other Figures
- All Figure Page
- Back to All Figure Page
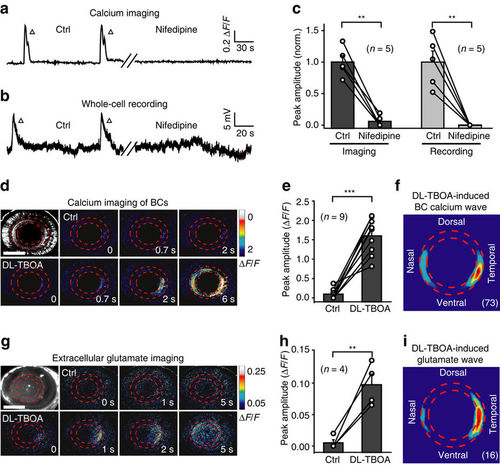
Glutamate release from BC ATs is important for BC wave occurrence. (a,b) Examples showing spontaneous calcium activities (a) and electrical activities (b) of BCs before (left) and 10 min after (right) bath application of nifedipine (50 μM). (c) Summary of data showing the effects of nifedipine on BC waves. Data obtained from the same larva are connected by a line. (d,e) Examples and summary of data showing that BC calcium waves were facilitated by bath application of DL-TBOA (50 μM) in a 3-d.p.f. Tg(Gal4-VP16xfz43,UAS:GCaMP1.6) larva. Scale bar, 100 μm. (f) Superposition of the initiation site of 73 BC calcium waves occurred under DL-TBOA application. (g) In vivo iGluSnFR-based extracellular glutamate imaging showing glutamate signals before (top) and 20 min after (bottom) bath application of DL-TBOA (50 μM) in a 3 d.p.f. larva expressing the glutamate biosensor iGluSnFR (left top). Scale bar, 100 μm. (h) Summary of glutamate imaging data. (i) Superposition of the initiation site of 16 glutamate waves under DL-TBOA application. **P<0.01, ***P<0.001; two-tailed paired Student’s t-test for the data in (c,e,h). Data are represented as mean±s.e.m. |