
Fig. 2
- ID
- ZDB-FIG-170824-42
- Publication
- Zhang et al., 2016 - Stereotyped initiation of retinal waves by bipolar cells via presynaptic NMDA autoreceptors
- Other Figures
- All Figure Page
- Back to All Figure Page
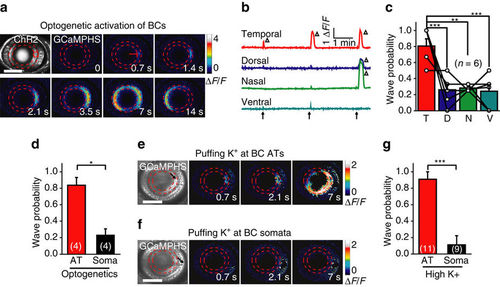
Axon terminals of BCs initiate retinal waves. (a) Time-lapse two-photon images showing a BC calcium wave evoked by 0.5 s optogenetic stimulation (started at time zero) at a cluster of ChR2-expressing BC ATs (red circle) in a transgenic Tg(Ribeye:ChR2-CFP,Gal4-VP16xfz43,UAS:GCaMPHS) larva. Left top, ChR2-CFP expression pattern in BCs. Red arrow, initiation site of the wave. Scale bar, 100 μm. (b) Repetitive optogenetic stimulation (arrow)-evoked calcium activities of BC ATs at four stimulation sites. The triangles mark the occurrence of calcium waves. (c) Occurrence probability of calcium waves evoked by optogenetics activation of BC ATs at different retinal regions. Data obtained from the same larva are connected by a line. The number in the brackets indicates the number of larvae examined. T, D, N and V indicate the temporal, dorsal, nasal and ventral retina, respectively. (d) Occurrence probability of calcium waves evoked by optogenetics stimulation at the AT or soma of BCs in the temporal retina. The number in the brackets represents the number of larvae examined. (e,f) BC calcium waves were evoked by local puffing of KCl (100 mM) at the ATs (e) but not the somata (f) in a 3-d.p.f. Tg(Gal4-VP16xfz43,UAS:GCaMP1.6) larva. The arrows in the bright-field images indicate the tip position of puffing micropipettes. The apparent increase in calcium signal around the puffing site (f) was due to puffing-induced displacement of BC somata. The puffing (0.1 s in duration) was performed at time zero. Scale bar, 100 μm. (g) Occurrence probability of calcium waves evoked by KCl puffing at the AT or soma of BCs in the temporal retina. *P<0.05, **P<0.01, ***P<0.001; one-way ANOVA for the data in (c), two-tailed paired Student’s t-test for the data in d, two-tailed unpaired Student’s t-test for the data in (g). Data are represented as mean±s.e.m. |