
|
Fig. 1
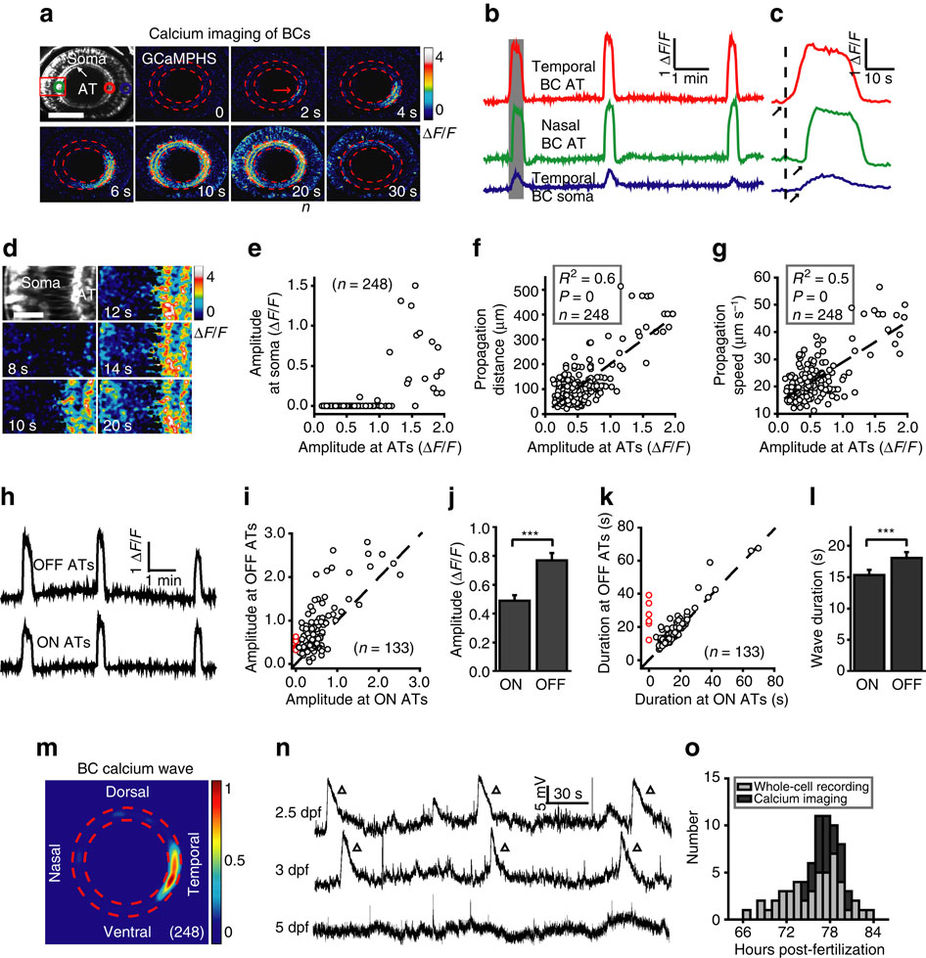
Developing bipolar cells display spontaneous wave activities in intact zebrafish larvae.
(a) Pseudocolor time-lapse two-photon images showing a spontaneous calcium wave of bipolar cells (BCs) in a 3 d.p.f. Tg(Gal4-VP16xfz43,UAS:GCaMPHS) larva. Left top, fluorescence image showing the retinal structure and GCaMPHS expression in BCs. ‘AT’ and ‘Soma’ indicate the axon terminal and soma of BCs, respectively. Red arrow, initiation site of the wave. The area between the two red dashed circles is the location of the inner plexiform layer (IPL). Dorsal is up, and temporal is right. The same orientation is used for images in all of the following figures. Scale bar, 100 μm. (b) Calcium activities of three regions of interest in (a, colour circles). The shadowed area marks the period of images shown in a. (c) The first calcium wave in b at a higher time resolution. The arrows mark the onset of calcium activities. (d) Magnified time-lapse images of the boxed region in a showing the invasion of calcium waves from ATs to somata of BCs. Scale bar, 20 μm. (e–g) Plots of the peak amplitude of calcium waves at BC ATs in the initiation site versus their peak amplitude at BC somata (e) and propagation distance (f) and speed (g) at the IPL. The dotted lines represent linear regression. N=number of waves recorded. (h) Calcium activities of ON and OFF ATs at the initiation sites of the three waves in (b). (i,k) Plots of the peak amplitude (i) or duration (k) of BC calcium waves at ON ATs versus that at OFF ATs. The dotted lines represent the orthogonal. The red circles indicate six BC waves, which only initiated and propagated at OFF ATs in the nasal retina (Supplementary Fig. 2c,d). (j,l) Summary of data showing the peak amplitude (i) or duration (k) of calcium waves at BC ON or OFF ATs, respectively. (m) Superposition of the initiation site of 248 BC calcium waves from 23 larvae. Colour bar, normalized frequency of wave initiation. (n) Spontaneous electrical activities of BCs monitored with in vivo whole-cell recording in larvae at 2.5–5 days post-fertilization (d.p.f.). The triangles mark wave-like events of giant depolarizing potentials (GDPs). (o) Temporal distribution of BC wave occurrence during development. Whole-cell recording and calcium imaging data were obtained from 47 and 23 larvae, respectively. ***P<0.001; Statistical analysis was performed with ANOVA for the data in (f,g) and two-tailed paired Student’s t-test for the data in (j,l). Data are represented as mean±s.e.m.