
- Title
-
Transient laminin beta 1a Induction Defines the Wound Epidermis during Zebrafish Fin Regeneration
- Authors
- Chen, C.H., Merriman, A.F., Savage, J., Willer, J., Wahlig, T., Katsanis, N., Yin, V.P., Poss, K.D.
- Source
- Full text @ PLoS Genet.
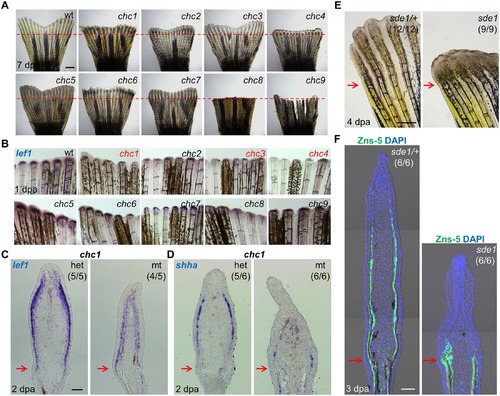
Forward genetic screen for signaling defects in the fin regeneration epidermis. (A) Whole-mount images of wild-type and (chc1-9) mutant regenerates at 7 days post amputation (dpa). Red dashed lines indicate plane of amputation. Scale bars, 1 mm. (B) Whole-mount RNA ISH of lef1 expression in wild-type and mutant regenerates at 1 dpa. chc1, chc3, and chc4 mutant families show reduced or undetectable lef1 expression when compared to their respective heterozygous siblings. (C, D) Longitudinal sections of 2 dpa fin regenerates assessed by RNA ISH, showing reduced lef1 and shha in chc1 mutant regenerates. (E) Whole-mount images of sde1 (formerly, chc1) fin regenerates at 4 dpa. Scale bars, 0.5 mm. (F) Longitudinal sections of 3 dpa fin regenerates show impaired patterning of osteoblasts in sde1 (chc1) mutants, assessed by Zns-5 antibody staining (green). DAPI, blue. Scale bars, 50 µm (unless otherwise indicated). Red arrows indicate plane of amputation. |
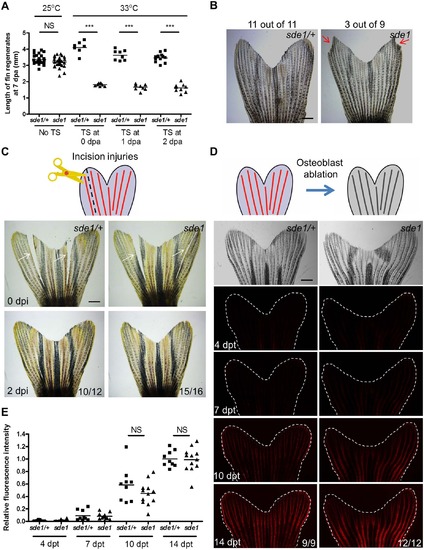
sde1 requirements for tissue regeneration depend on injury context. (A) Measurement of sde1 fin regenerates at 7 dpa. After amputation, animals were shifted from the permissive temperature (25°C) to the restrictive temperature (33°C) at 0, 1 or 2 dpa. TS, temperature shift. (n = 15, 16, and 21; Student’s t -test, ***P < 0.001; NS, non-significant). (B) Adult sde1/+ and sde1 animals were incubated at 33°C for two months (n = 11 and 9). Red arrows point to a damaged fin edge in sde1. The most severe example of damage in sde1 animals is displayed here (3 of 9 showed damage in the experiment). (C) (Top) Cartoon depicting the model of incision injuries. (Bottom) Whole-mount images were acquired at 0 and 2 days post incision injury (dpi). Images from the same animal are shown before (top) and after repair (bottom). White arrows indicate sites of injury (n = 12 and 16). (D) (Top) Cartoon depicting the model of osteoblast ablation. (Bottom) Fluorescence intensity, indicating recovery of genetically labeled osteoblasts after ablation, was recorded at 4, 7, 10, and 14 days post Mtz treatment (dpt) and quantified using ImageJ software. White dashed lines indicate fin boundaries. Images from the same animal are shown throughout recovery. (E) Quantification of relative fluorescence intensity from individual animals after osteoblasts ablation (n = 9 and 12; mean ± SEM; Student’s t-test; NS, non-significant). Scale bars, 1 mm. |
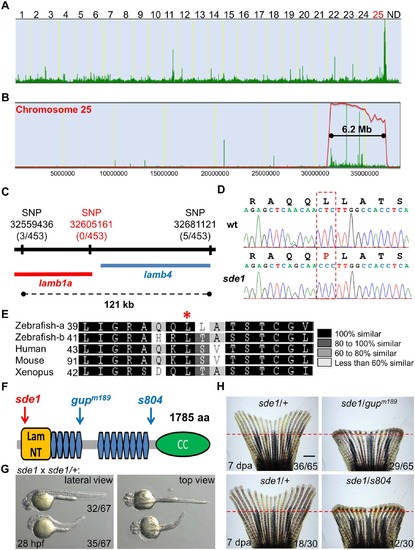
sde1 encodes a laminin beta1 paralog. (A) Analysis of genomic homozygosity in sde1 mutants. (B) Log likelihood analysis using SNPtrack. (C) High-resolution mapping using linked SNP markers. Three and five recombinants were found for SNP32559436 and SNP32681121, respectively, on each side of a 121 kb region. After genotyping 453 adult animals, no recombinants were identified for a novel SNP at position 32605161. (D) Sanger sequencing readouts from wild-type and sde1 cDNA. SNP32605161 is within the coding region of the gene laminin beta 1a (lamb1a), causing a leucine to proline change. (E) Amino acid alignment across distant species. Red star marks the location of the leucine. Differential gray scale indicates level of conservation across listed species. (F) Cartoon depicting major structural domains in Lamb1a. Blue and red arrows indicate the locations of the sde1 mutation, along with two previously identified alleles gupm189 and s804. Lam NT, Laminin N-terminal domain; Blue hexagons, Laminin-type epidermal growth factor-like domain; CC, uncharacterized coiled-coil domain. (G) sde1 embryos incubated at 31°C have shortened trunks. Representative embryos from an sde1 x sde1/+ cross. Embryos were transferred to 31°C at 3 hours post-fertilization (hpf). Images were acquired at 28 hpf. Approximately 48% of embryos (32 out of 67) showed phenotypes representative of the gupm189 mutation after the temperature shift, consistent with expected Mendelian ratio. The phenotype and the ratio were consistent across three independent crosses. (H) Complementation tests showing both gupm189 and s804 alleles fail to complement the 7 dpa regeneration defects of the sde1 mutation in adult animals, yielding expected ratios (~50%; n = 65 and 30). Red dashed lines indicate plane of amputation. Scale bars, 1 mm. |
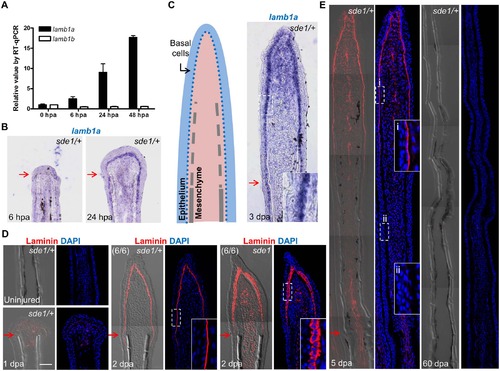
lamb1a, not lamb1b, is induced during regeneration. (A) RT-qPCR analysis indicates that lamb1a, but not lamb1b, is induced during regeneration. qPCR results were normalized to rpl13a and to the basal expression of lamb1a/lamb1b at 0 hours post-amputation (hpa). (n = 3; mean ± SEM). (B) Section ISH indicating that lamba1 becomes visually detectable in the basal epithelial layer between 6 and 24 hpa. (C) Left: cartoon depicting basic cellular makeup of the fin regenerate. Right: lamb1a is expressed in basal epithelial cells and some mesenchymal cells at 3 dpa. (D) Antibody staining for Laminin expression in regenerating fins. Laminin protein is restricted to the basal side of the basal epithelial cells layer by 2 dpa in wild-type or sde1/+ regenerates, but mislocalized to all regions of basal cells in sde1 mutants. (E) Laminin expression at 5 dpa and 60 dpa, indicating that Laminin presence is transient during regenerative outgrowth. i: distal, newly regenerated tissue; ii: proximal regenerated tissue. Laminin, red; DAPI, blue. Scale bars, 50 µm. White dashed boxes indicate areas of enlarged view. Red arrows indicate plane of amputation. |
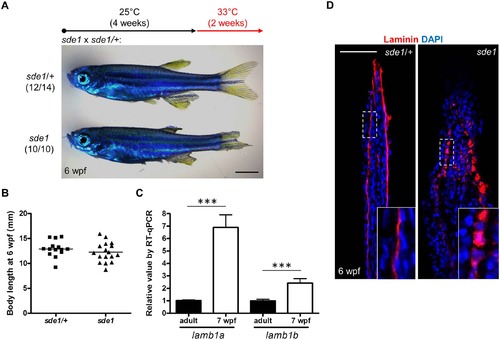
lamb1a is required for juvenile fin growth but not body growth. (A) Juvenile sde1 animals, after incubation from 4 to 6 weeks post-fertilization (wpf) at 33°C, acquire degraded fins. Scale bars, 2 mm. (B) sde1 mutations have minimal impact on juvenile outgrowth. Body length was measured from the tip of the snout to the base of caudal fin. (C) RT-qPCR analysis indicates that both lamb1a and lamb1b are induced in fin tissue during juvenile outgrowth. qPCR results were normalized to rpl13a and to the basal expression of lamb1a/lamb1b in adult uninjured fins (n = 4; mean ± SEM). (D) Antibody staining for Laminin expression in juvenile fins. Laminin protein in longitudinal sections of fins is localized to the basal side of the epitheilum in sde1/+ animals, but becomes mislocalized in sde1 mutants. EXPRESSION / LABELING:
PHENOTYPE:
|
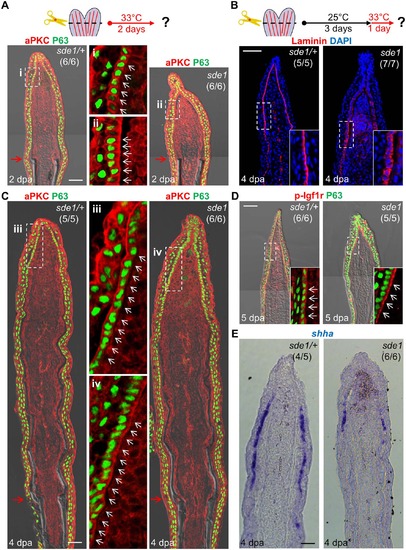
lamb1a induction defines cell polarity and signaling competence in basal cells of the regeneration epidermis. (A) Antibody co-staining for aPKC (red) and P63 (green; an epithelial maker for all basal and some suprabasal epithelial cells) in longitudinal sections of sde1/+ and sde1 fin regenerates at 2 dpa. (B) Antibody staining for Laminin in fin regenerates at 4 dpa after a temperature shift from 25°C to 33°C at 3 dpa, indicating induced mislocalization. Laminin, red; DAPI, blue. White dashed boxes indicate areas of enlarged view. (C) Antibody co-staining for aPKC (red) and P63 (green) in longitudinal sections of sde1/+ and sde1 fin regenerates at 4 dpa after a temperature shift from 25°C to 33°C at 3 dpa, indicating loss of basal cell polarity. iii: distal regenerated tissue (sde1/+); iv: distal regenerated tissue (sde1). White arrows indicate basal cell nuclei. (D) Antibody co-staining for phosphorylated Igf1r (red) and P63 (green) in longitudinal sections of 5 dpa sde1/+ and sde1 fin regenerates, after a temperature shift from 25°C to 33°C at 4 dpa. The basal localization of p-Igf1r is enriched in basal epithelial cells in sde1 mutants. (E) shha RNA expression is reduced in sde1 fin regenerates at 4 dpa after a temperature shift from 25°C to 33°C at 3 dpa. Scale bars, 50 µm. White dashed boxes indicate areas of enlarged view. Red arrows indicate plane of amputation. |
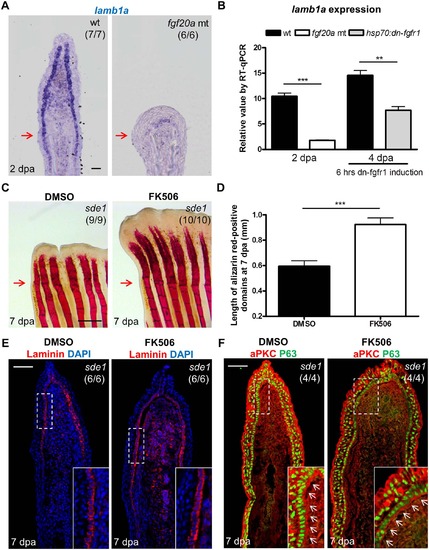
Association of lamb1a expression and function with key regeneration effector pathways. (A) Longitudinal sections of 2 dpa fin regenerates stained for lamb1a by ISH, indicating sparse expression in fgf20a mutants (dob). Scale bars, 50 µm. (B) RT-qPCR analysis indicating depleted levels of lamb1a RNA in fgf20a mutants (left). When Fgf signaling is blocked by induced expression of a dominant–negative Fgf receptor for just 6 hours at 4 dpa, lamb1a levels drop by nearly 50%. qPCR results were normalized to rpl13a and to the basal expression of lamb1a at 0 hpa. (n = 4; mean ± SEM; Student’s t -test, ***P < 0.001, **P < 0.01). (C) Whole-mount images of fin regenerates stained by alizarin red staining for calcium deposition, after treatment of sde1 animals with DMSO or FK506. Scale bars, 0.5 mm. (D) Measurement of the length of alizarin red-positive domains at 7 dpa (n = 9 and 10; mean ± SEM; Student’s t -test, ***P < 0.001). (E) Antibody staining for Laminin protein in vehicle- or FK506-treated sde1 fin regenerates at 7 dpa. Laminin, red; DAPI, blue. (F) Antibody co-staining for aPKC (red) and P63 (green) expression in vehicle or FK506-treated sde1 fin regenerates at 7 dpa. FK506 treatment partially rescued bone regeneration in sde1 mutants, with no detectable impact on Laminin localization or basal epithelial cell polarity. Scale bars, 50 µm. White dashed boxes indicate areas of enlarged view. White arrows indicate basal cell nuclei. Red arrows indicate plane of amputation. |
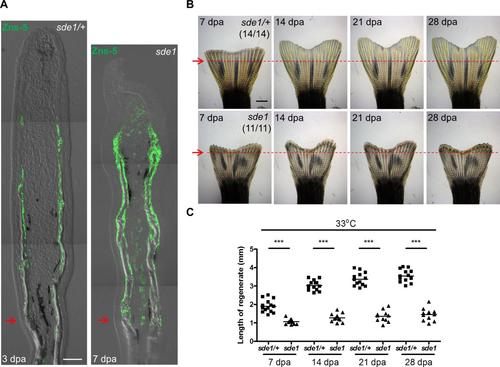
Osteoblast patterning in sde1 fin regenerates at 7 dpa. (A) sde1 regenerates (right) are severely shortened at 7 dpa, comparable to a 3 dpa clutchmate sample (left). Osteoblasts (green) line the bone in proximal areas but accumulate in masses in distal regions. Scale bars, 50 µm. Red arrows indicate plane of amputation. (B) Whole-mount images of sde1/+ and sde1 regenerates at 7, 14, 21, and 28 dpa. Images from the same animal are shown here across different time points. Red arrows and dashed lines indicate plane of amputation. Scale bars, 1 mm. (C) Measurement of fin regenerates at different time points (n = 14 vs. 11; Student’s t -test, ***P < 0.001). |
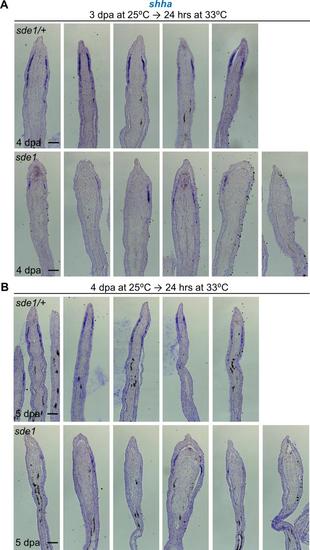
lamb1a induction defines signaling competence in basal cells of the regeneration epidermis. (A) shha RNA expression is reduced in sde1 regenerates at 4 dpa after a temperature shift from 25°C to 33°C at 3 dpa. (B) Similar results were observed in sde1 regenerates at 5 dpa after a temperature shift at 4 dpa. Scale bars, 100 µm. Representative images from different samples are shown here. |
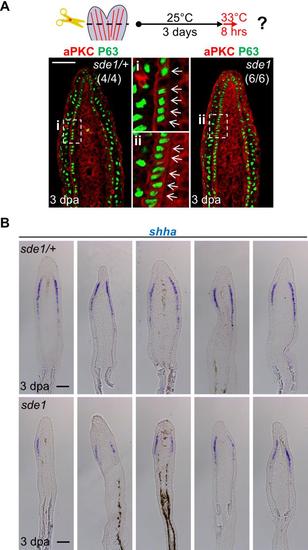
Eight hours of 33°C treatment is sufficient to alter aPKC localization and reduce shha expression in sde1 regenerates. (A) Antibody co-staining for aPKC (red) and P63 (green) in longitudinal sections of sde1/+ and sde1 fin regenerates after 8 hours of 33°C treatment at 3 dpa, indicating rapid loss of basal cell polarity. Scale bars, 50 µm. (B) shha RNA expression is also reduced in sde1 regenerates after 8 hours of 33°C treatment (n = 5 each). Scale bars, 100 µm. |
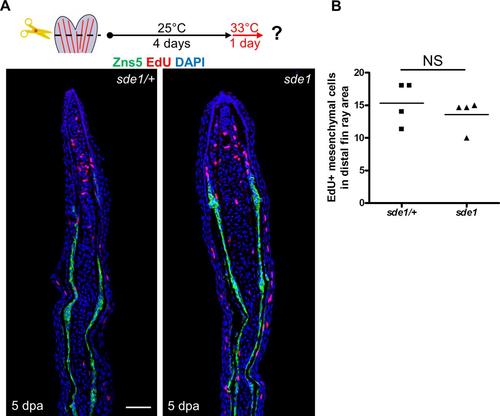
EdU incorporation assays in sde1 and control regenerates. (A) Longitudinal sections of 5 dpa fin regenerates collected after 60 minutes of EdU incorporation. (B) Counting of EdU+ mesenchymal cells in distal fin ray area. Mesenchymal cell proliferation was grossly similar between sde1/+ and sde1 regenerates at 5 dpa after a temperature shift from 25°C to 33°C at 4 dpa. Scale bars, 50 µm. (n = 4, counts from three sections were averaged for each sample; Student’s t -test, NS, non-significant). |
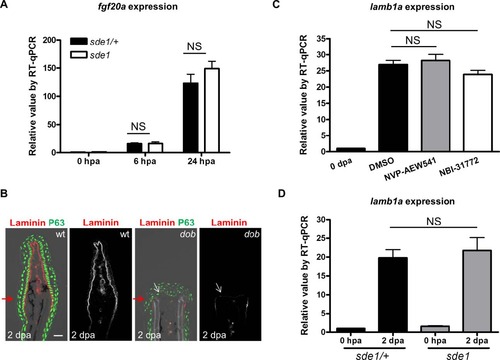
Tests of association between fgf20a and lamba1. (A) RT-qPCR analysis for levels of fgf20a in sde1 fin regenerates. qPCR results were normalized to rpl13a and to the basal expression of fgf20a at 0 hpa. (n = 3; mean ± SEM; Student’s t -test, NS, non-significant). (B) Antibody co-staining for Laminin (red) and P63 (green) in longitudinal sections of wild-type and dob fin regenerates at 2 dpa. Scale bars, 50 µm. White arrows indicate where (low) levels of Laminin are detectable. Red arrows indicate plane of amputation. (C) RT-qPCR analysis lamb1a levels in 4 dpa wild-type fin regenerates after 24 hours of treatment with either Igf receptor antagonist NVP-AEW541 (2 µM), or Igf signaling agonist NBI-31772 (10 µM). (D) RT-qPCR analysis of lamb1a levels in 2 dpa sde1/+ and sde1 fin regenerates at the restrictive temperature. qPCR results were normalized to rpl13a and to the basal expression of lamb1a at 0 hpa. (n = 4; mean ± SEM; Student’s t -test, NS, non-significant). |
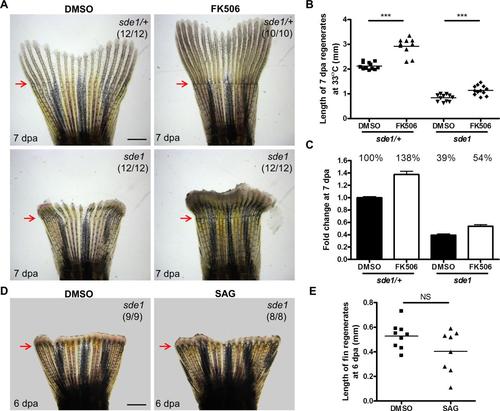
FK506 treatment, but not SAG treatment, significantly increases the length of sde1 regenerates. (A) Whole-mount images of sde1/+ and sde1 fin regenerates at 7 dpa after treatment of DMSO (0.04%) or FK506 (0.1 µg/ml). Scale bars, 1 mm. (B) Measurement of the fin length at 7 dpa (Student’s t -test, ***P < 0.001). (C) Fold change of fin regenerates at 7 dpa. Relative values are normalized to the length of sde1/+ regenerates after DMSO treatment (mean ± SEM). (D) Whole-mount images of sde1/+ and sde1 fin regenerates at 6 dpa after treatment of DMSO (0.05%) or SAG (5 µM). (E) Measurement of the fin lengths at 6 dpa (Student’s t -test, NS, non-significant). |
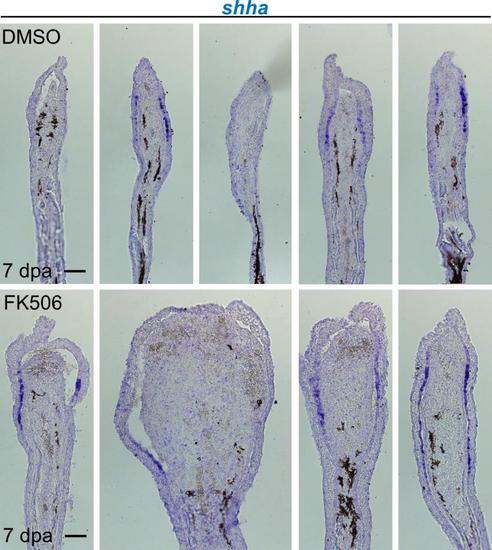
Impact of FK506 treatment on shha RNA expression in sde1 regenerates. shha RNA expression was grossly similar between DMSO- and FK506-treated sde1 regenerates at 7 dpa. Consistent with S3 Fig, sde1 regenerates have a reduced level of shha expression. Scale bars, 100 µm. Representative images from different samples are shown here. |