
|
Fig. 4
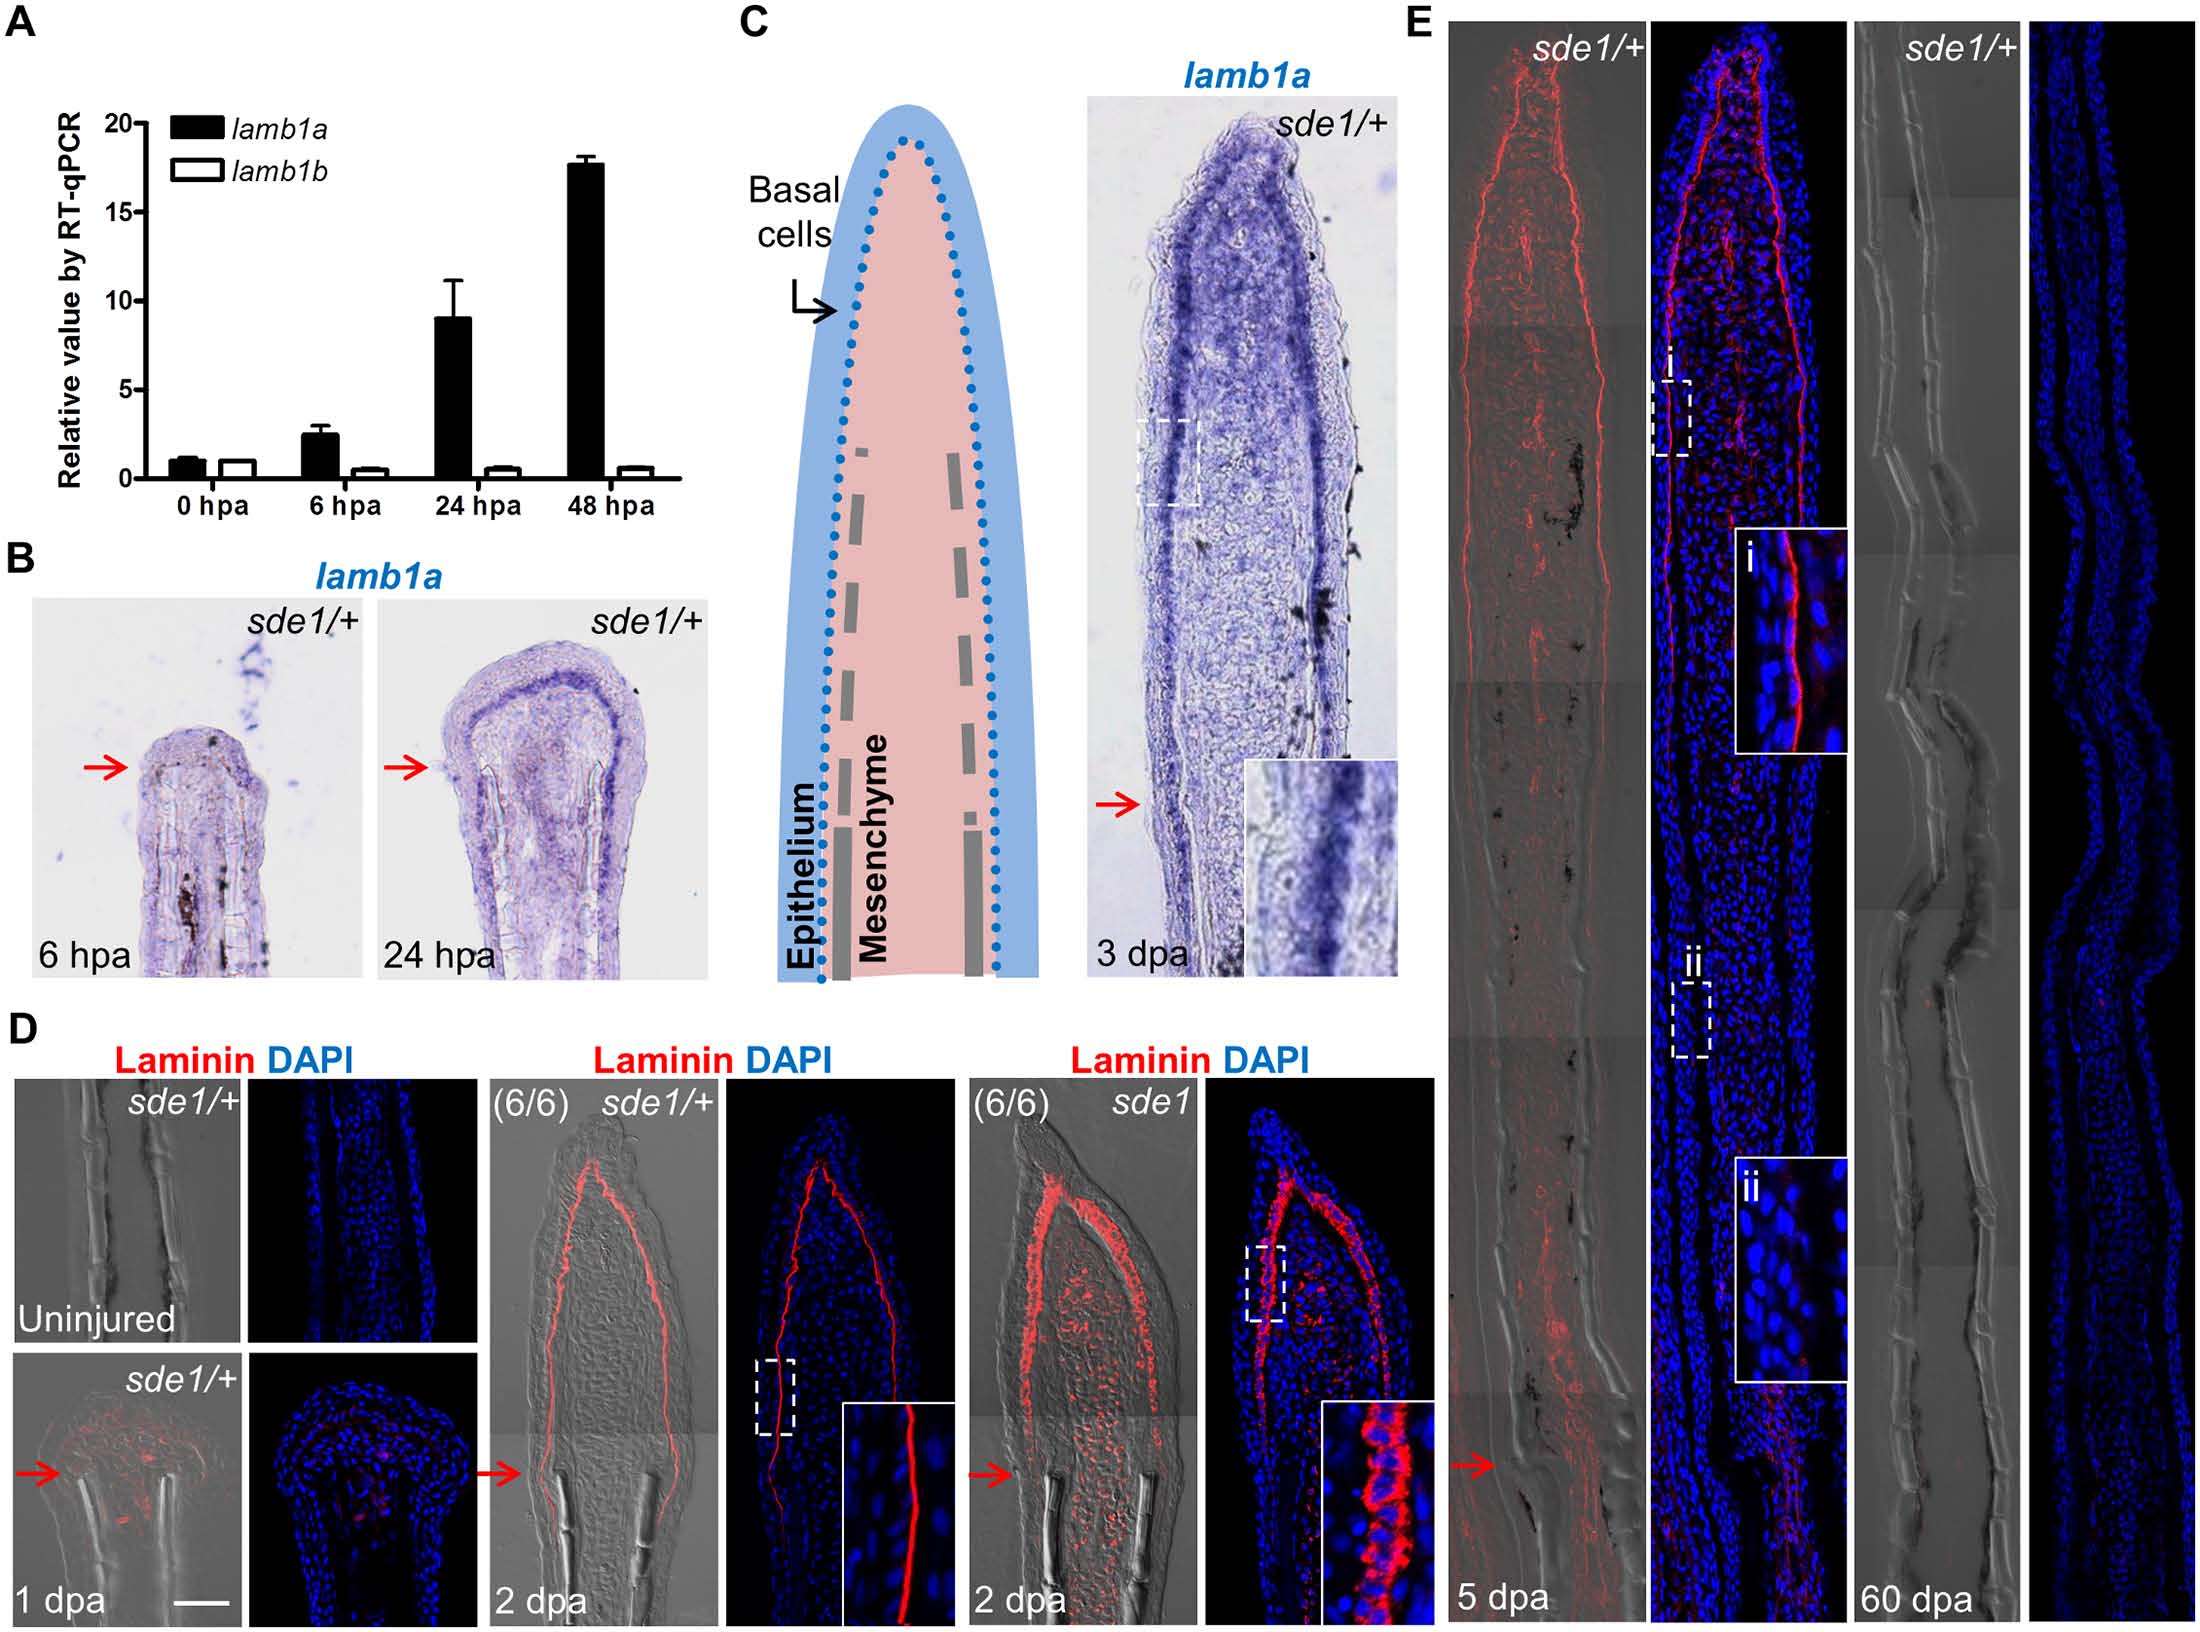
lamb1a, not lamb1b, is induced during regeneration.
(A) RT-qPCR analysis indicates that lamb1a, but not lamb1b, is induced during regeneration. qPCR results were normalized to rpl13a and to the basal expression of lamb1a/lamb1b at 0 hours post-amputation (hpa). (n = 3; mean ± SEM). (B) Section ISH indicating that lamba1 becomes visually detectable in the basal epithelial layer between 6 and 24 hpa. (C) Left: cartoon depicting basic cellular makeup of the fin regenerate. Right: lamb1a is expressed in basal epithelial cells and some mesenchymal cells at 3 dpa. (D) Antibody staining for Laminin expression in regenerating fins. Laminin protein is restricted to the basal side of the basal epithelial cells layer by 2 dpa in wild-type or sde1/+ regenerates, but mislocalized to all regions of basal cells in sde1 mutants. (E) Laminin expression at 5 dpa and 60 dpa, indicating that Laminin presence is transient during regenerative outgrowth. i: distal, newly regenerated tissue; ii: proximal regenerated tissue. Laminin, red; DAPI, blue. Scale bars, 50 µm. White dashed boxes indicate areas of enlarged view. Red arrows indicate plane of amputation.